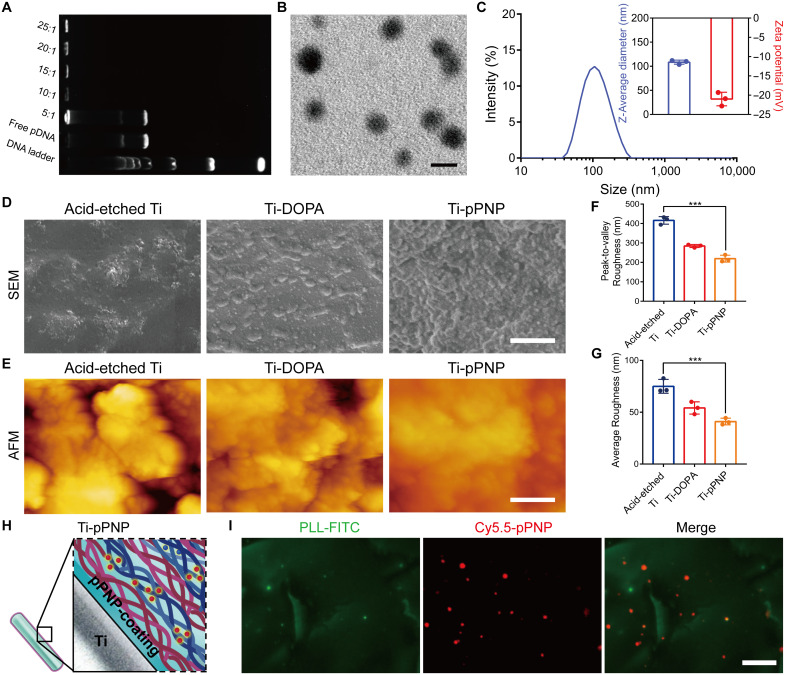
Fig. 2. Design and characterization of the pPNP coating.
(A) Gel retardation assay of the pPNP. (B) Transmission electron microscopy (TEM) images of PNPs with a weight ratio of peptide-SA:pDNA of 10:1. Scale bar, 100 nm. (C) Zeta potential and size distributions of PNPs with a weight ratio of SA monomers:pDNA of 10:1. (D) Surface morphology and cross-sectional view of different titanium-based surfaces investigated by scanning electron microscopy (SEM). Scale bar, 1 μm. (E) Three-dimensional reconstructed surface roughness images of different titanium-based surfaces as investigated by atomic force microscopy (AFM). Scale bar, 1 μm. (F and G) Quantitative measurement of surface roughness parameters of different titanium-based surfaces. (H) Schematic illustration of the coating structure. (I) Representative fluorescent images of coating, in which poly-l-lysine (PLL) was labeled with fluorescein isothiocyanate (FITC) and pPNP with Cy5.5 (Cy5.5-labeled pPNP). Scale bar, 25 μm. Data are presented as means ± SD. n = 3 independent experiments per group, ***P < 0.001.

