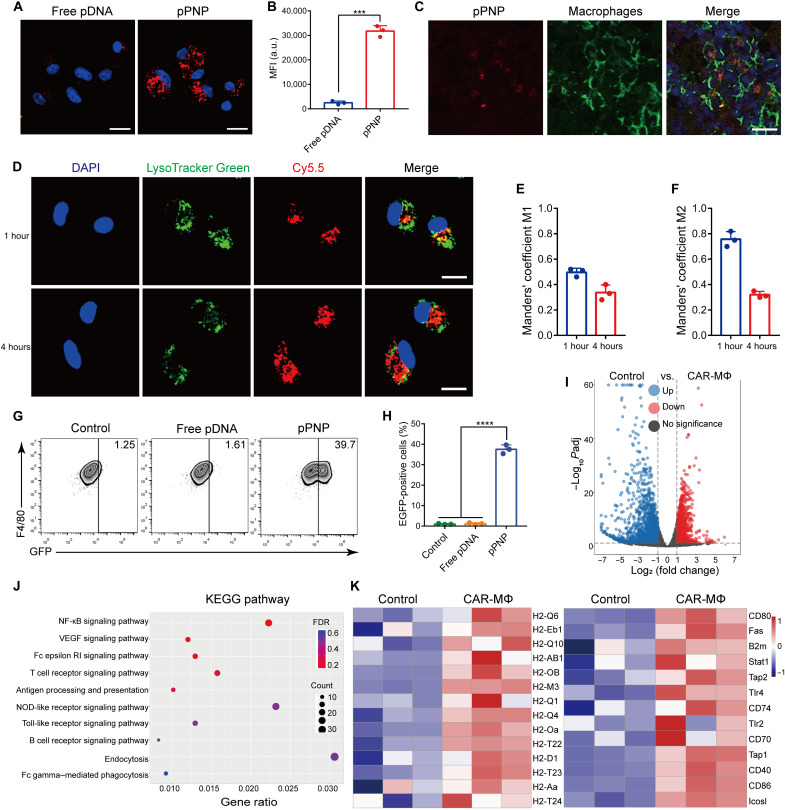
Fig. 3. pPNP-mediated SasA-CAR programming in MΦs.
(A) Confocal images of BMDMs treated with free pDNA or pPNP. The nuclei were counterstained with 4′,6-diamidino-2-phenylindole (DAPI) (blue). Scale bars, 20 μm. (B) Cellular uptake of free pDNA or pPNP by BMDMs as measured through flow cytometry analysis. MFI, mean fluorescence intensity; a.u., arbitrary units. (C) Immunofluorescence staining showing that pPNPs (red) colocalized with F4/80+ MΦs (green). Scale bar, 25 μm. (D) Typical confocal images of BMDMs incubated with pPNPs for 1 or 4 hours at 37°C. The cell nuclei were stained using DAPI (blue), the endo/lysosomes were stained using LysoTracker Green (green), and pDNAs were labeled with Cy5.5 (red). Scale bars, 20 μm. (E and F) Quantitative analysis of the colocalization of Cy5.5-labeled pDNA with endo/lysosomes labeled with LysoTracker Green. (G and H) Percentage of EGFP-positive BMDMs treated with free pDNA or pPNP. (I) Volcano plot of genes differentially expressed in BMDMs versus CAR-MΦs. (J) Kyoto Encyclopedia of Genes and Genomes (KEGG) pathway analysis of the identified differentially expressed genes. NF-κB, nuclear factor κB; VEGF, vascular endothelial growth factor. (K) Heatmap of differentially expressed antigen-presentation genes and inflammatory genes between BMDMs and pPNP-transduced CAR-MΦs. Data are presented as means ± SD. n = 3 independent experiments per group, ***P < 0.001.

