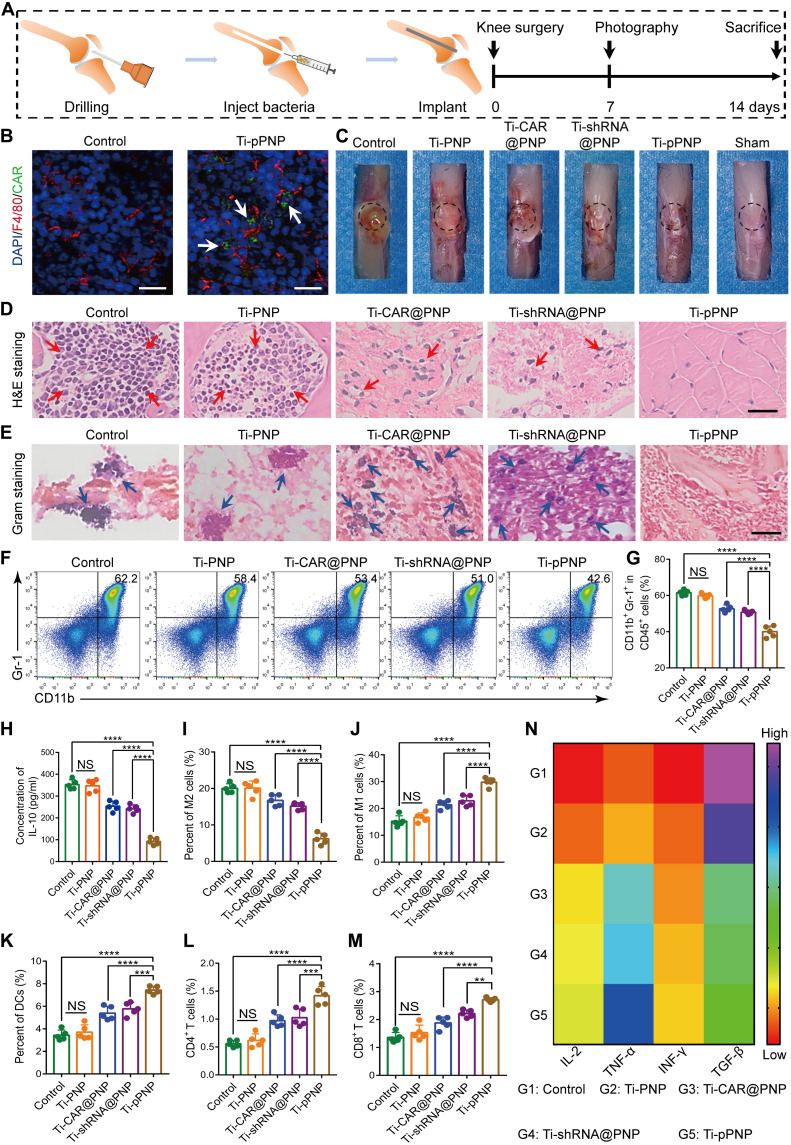
Fig. 5. pPNP coating-induced anti-infection and immunomodulation effects in vivo.
(A) Schematic illustration of the experimental design. (B) EGFP-positive MΦs (white arrows) at the bone-implant interfaces of mice after their treatment with pPNP. Blue, DAPI-stained cell nuclei; red, F4/80+ MΦs. Scale bars, 25 μm. (C) Representative mouse knee joint images at 7 days after implantation. (D) Hematoxylin and eosin (H&E) staining of the bone tissues surrounding the implants. Red arrows indicate the infiltration of inflammatory cells. Scale bar, 100 μm. (E) Gram staining of the bone tissues surrounding the implants. Blue arrows indicate scattered bacteria. Scale bar, 50 μm. (F and G) Representative flow cytometry plots (F) and quantitative analysis (G) of CD11b+Gr1+ myeloid-derived suppressor cells in MRSA-infected bone tissues at day 14 after infection. (H) IL-10 levels in implant-associated tissue, as measured by ELISA. (I and J) Representative flow cytometry quantitative analysis of M2-like MΦs (F4/80+CD206+) (I) and M1-like MΦs (F4/80+CD80+) (J) in the implant-associated tissues of mice in the indicated treatment groups. (K) Mature dendritic cells (DCs) in the draining lymph nodes. (L and M) Representative flow cytometry quantitative analysis of the percentage of CD3+CD4+ (L) or CD3+CD8+ (M) T cells in the implant-associated tissues of mice in the indicated treatment groups. (N) Heatmap of the IL-2, TNF-α, IFN-γ, and TGF-β expression profiles in implant-associated tissues. Data are presented as means ± SD. n = 5 mice per group, **P < 0.01, ***P < 0.001, and ****P < 0.0001. NS, not significant.

