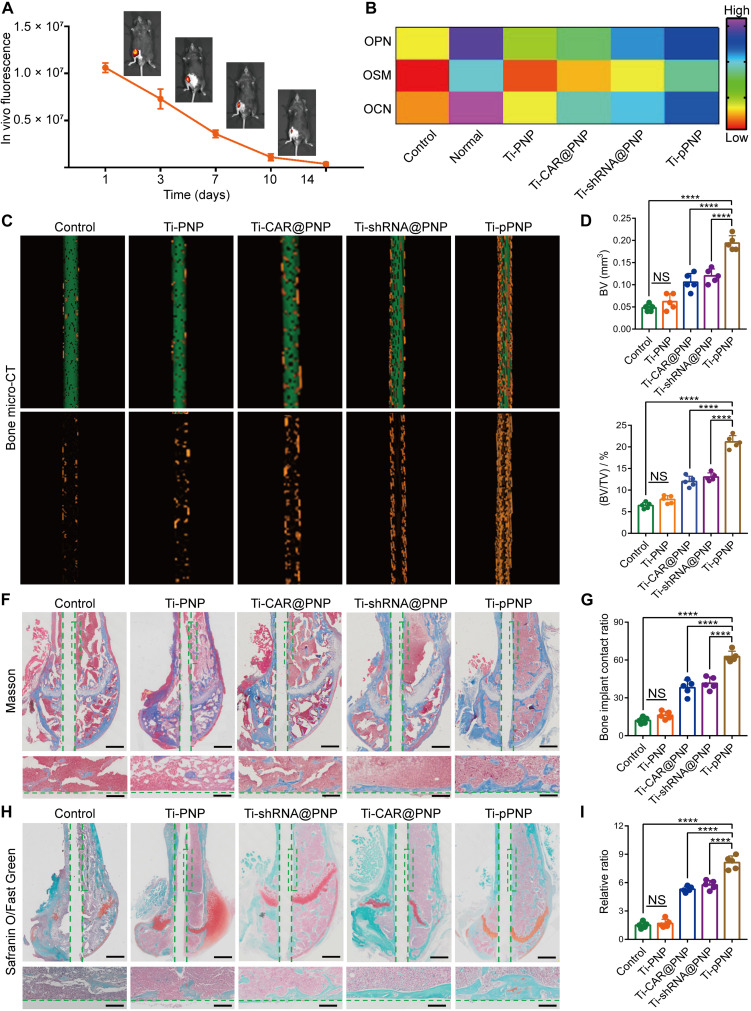
Fig. 6. Promoted osteogenesis of pPNP coating.
(A) In vivo biodegradation of pPNP coating labeled with Cy5.5, visualized using in vivo fluorescence imaging. The fluorescence scale shown was obtained directly from the in vivo imaging systems imaging scanner. (B) Heatmap of the OPN, OSM (oncostatin M), and OCN (osteocalcin) expression profiles in bone tissues. (C) Micro–computed tomography (micro-CT) images of implants in mouse femurs and three-dimensional reconstructed images showing the neonatal bone generation surrounding the implants (green, implant; yellow, bone tissue). (D and E) Quantitative statistics of the bone volume (BV) (D) and the percentage of BV to tissue volume (%, BV/TV) (E) calculated from the micro-CT data. (F) Representative Masson staining (blue, bone tissue) for the neonatal bone surrounding the implants. Scale bars, 200 and 50 μm. (G) Bone area ratios calculated from Masson-stained samples. The bone-implant contact ratio was calculated by comparing the accumulated length of the edge, where the implant contacts the bone tissue, to the implant circumference based on the images of Masson staining analysis. (H) Representative Safranin O/Fast Green staining (green, bone tissue) for the neonatal bone surrounding the implants. Scale bars, 200 and 50 μm. (I) Histomorphometric measurements of osteogenesis. The relative ratio was defined as the percentage of osteogenesis with a region extending 20 μm from the implant surface. Data are presented as means ± SD. n = 5 mice per group, ****P < 0.0001.

