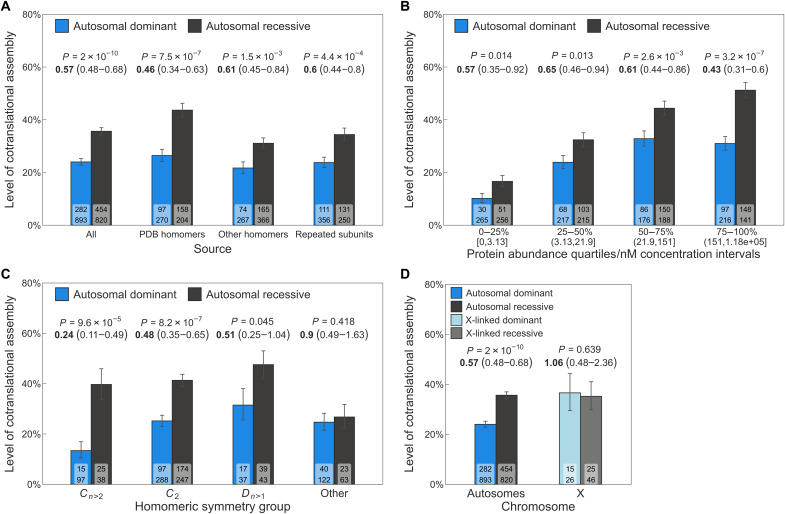
Fig. 2. AD genes are depleted in cotranslationally assembling subunits.
(A) Level of cotranslational assembly in homomers and repeated subunits among AD versus AR genes grouped by subunit source (see Methods). Bar values are percent level of cotranslational assembly; error bars are Jeffrey’s 68% binomial credible intervals. The P value from the hypergeometric test and the OR (in bold) and its 95% confidence interval are shown above the bars. Labels on bars are the count of cotranslationally assembling subunits (top) and all other subunits (bottom). (B) to (D) have the same parameters. (B) Level of cotranslational assembly binned into protein abundance quartiles. Each bin corresponds to 25% of proteins by count, and the corresponding approximate nanomolar concentration intervals are shown in brackets. (C) Level of cotranslational assembly in genes of homomers and repeated subunits with AD and AR disease inheritance split by symmetry groups: cyclic (Cn>2), twofold (C2), dihedral (Dn>1), and other. (D) Comparison of the level of cotranslational assembly in genes of homomers and repeated subunits on autosomes or the X chromosome.

