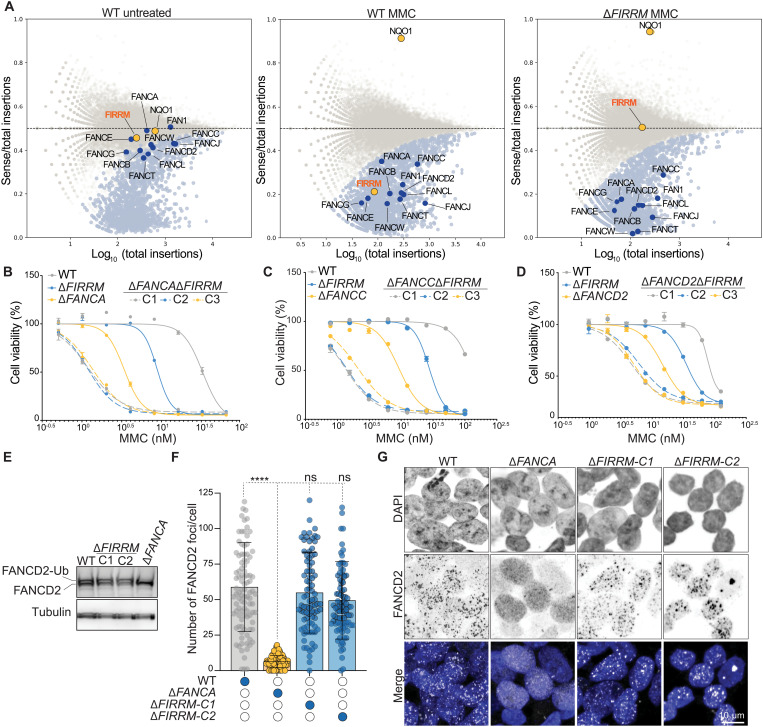
Fig. 5. FIRRM acts independently of the FA pathway.
(A) Fishtail plots depicting the fitness genes in untreated wild-type HAP1 cells or MMC-treated wild-type and FIRRM knockout HAP1 cells. Hits with a false discovery rate (FDR)–corrected P value ≤ 0.05 are highlighted in light blue, and NQO1 and FIRRM are highlighted in orange. FA pathway members are marked in dark blue. (B to D) Quantification of clonogenic survival assays in HAP1 cells of indicated genotypes. Data are displayed as means ± SEM., normalized to untreated. (E) Whole-cell extracts of wild-type, ΔFANCA, or ΔFIRRM HAP1 cells treated with 50 nM MMC were immunoblotted for FANCD2. (F and G) Quantification (F) and representative images (G) of an immunofluorescence staining for FANCD2 in wild-type, ΔFANCA, or ΔFIRRM HAP1 cells exposed to 50 nM MMC. All experiments were performed in triplicates except the genetic screens, which were done in duplicates. ****P < 0.0001.

