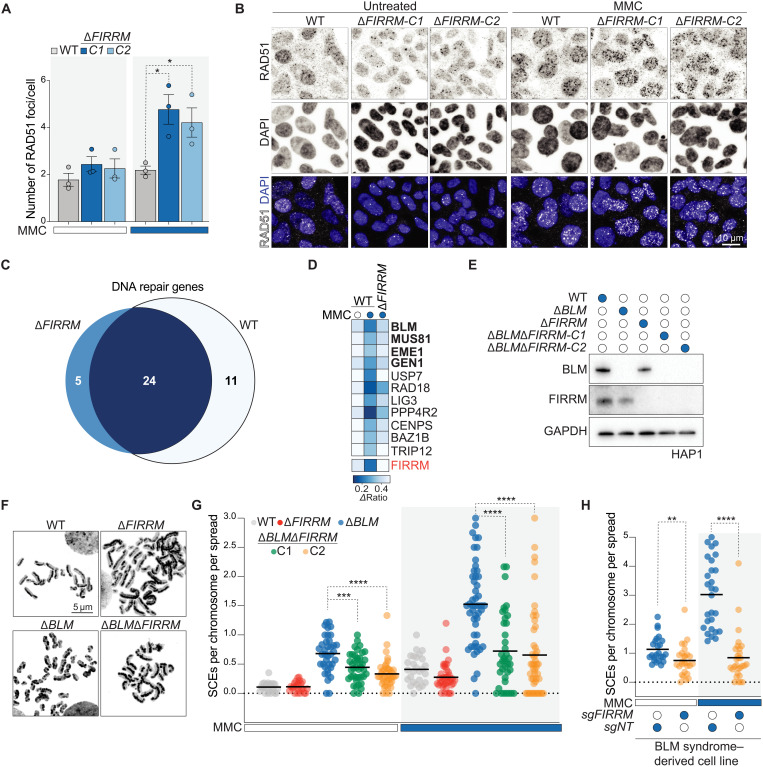
Fig. 6. FIRRM genetically interacts with factors resolving HR intermediates and promotes SCEs.
(A and B) HAP1 cells of indicated genotypes were left untreated or exposed to 50 nM MMC for 24 hours, pre-extracted, and stained for RAD51 and DAPI. Quantification of three independent biological replicates is shown in (A), and representative images are depicted in (B). P value was calculated by a two-tailed t test. At least 300 cells were analyzed per experiment, and data are depicted as means ± SEM. (C) Venn diagram of the DNA repair genes identified in the genetic screens in wild-type and FIRRM knockout cells after 12 days of MMC treatment. DNA repair genes that scored commonly in wild-type and FIRRM knockout cells (dark blue) and specifically in FIRRM knockout cells (light blue) are listed in fig. S11B. (D) Heatmap showing the DNA repair genes that were specifically identified in the wild-type but not in the FIRRM knockout screen. (E) Immunoblot of FIRRM and BLM single or double knockout HAP1 cell lines. (F) Representative images of metaphase spreads prepared from wild-type, ΔFIRRM, ΔBLM, or double knockout HAP1 cells treated with 50 nM MMC. (G) Quantification of SCE frequency. Every data point shows a metaphase that was scored blind for SCEs per chromosome per spread (>30 cells were analyzed for each condition). P value was calculated by the Mann-Whitney U test. (H) Quantification of SCE frequency in BS-derived patient cells (GM08505) transduced with a nontargeting sgRNA (sgNT) or sgFIRRM and exposed to 50 nM MMC or left untreated. P value was calculated by the Mann-Whitney U test. (B and E to H) Representative experiments of three independent experiments are displayed. *P < 0.05, **P < 0.01, ***P < 0.001, and ****P < 0.0001.

