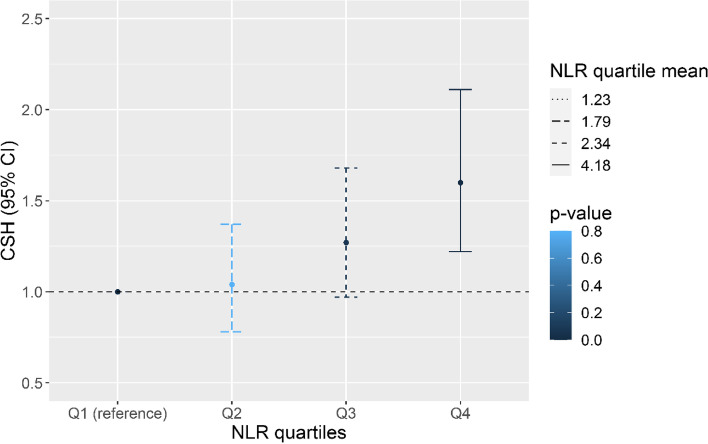
Fig. 3.
Adjusted Hazards for incidence of DR for different quartiles of NLR from the CSH Model. The model was adjusted for age, sex, HbA1c, eGFR, BMI, HDL, non-HDL-c, SBP, DBP, diabetes drug use at baseline, interaction terms for NLR quartiles with age, eGFR and HbA1c. Q1 denotes the first quartile and Q4 denotes the uppermost quartile. Quartile means for Q1–Q4 were 1.23, 1.79, 2.34 and 4.18, respectively. The Q1 is the reference category

