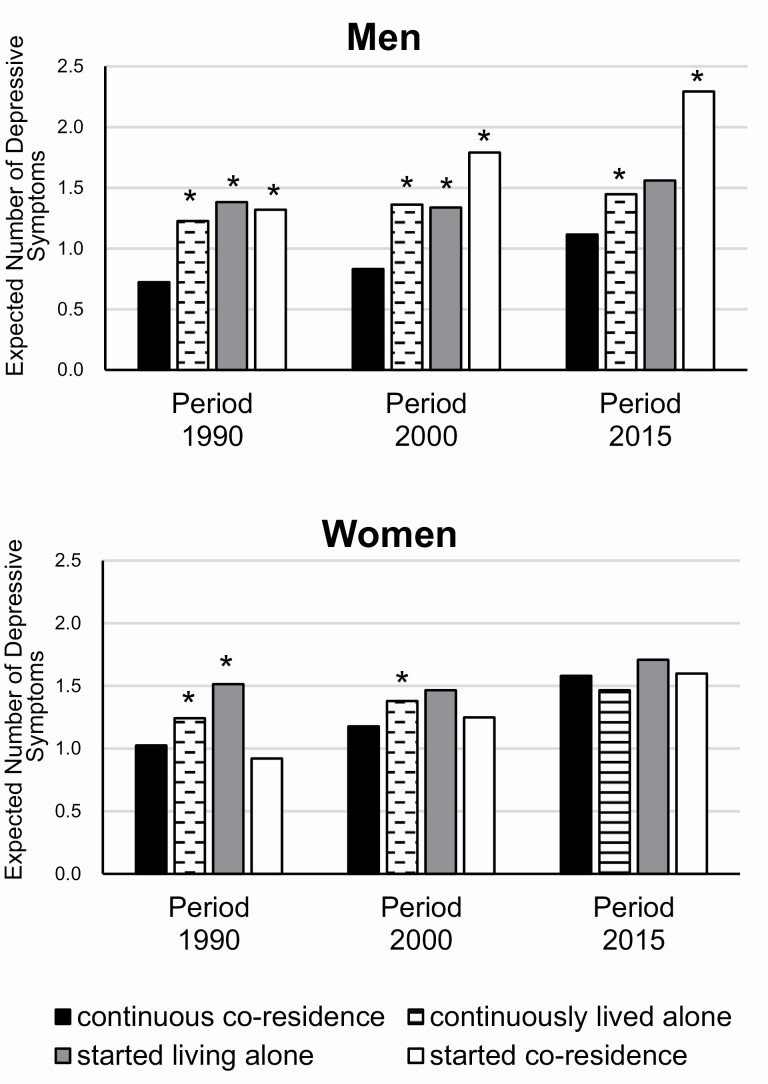
Figure 2.
Expected number of depressive symptoms by gender and time period. Estimation was made based on Model 3 in Table 3, assuming that level of urbanization and other covariates were their reference category or mean value. Because the sample size for starting coresidence was small, their estimates should be interpreted with caution. The asterisks (*) represent a significant difference (p < .05) from “continuous coresidence” in the same period, based on the results in Supplementary Table 5.

