Figure 7.
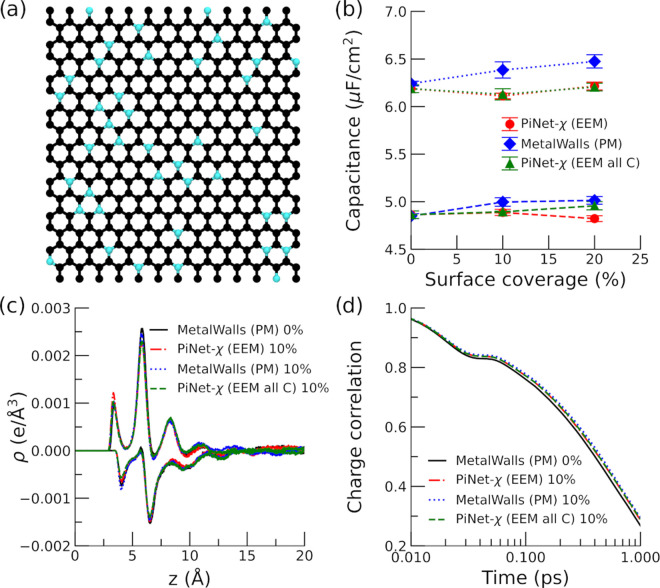
Nitrogen-doped graphene electrode. (a) Snapshot of the electrode surface with a 10% surface coverage (electrolyte solution is not shown for clarity). (b) Helmholtz capacitance for the positive and negative electrodes as a function of the surface coverage. Dashed lines correspond to the positive electrode while dotted lines correspond to the negative electrode. (c) Total charge density of ionic species as a function of the distance to the negative/positive electrode under an applied potential of 2 V. The distance is taken from the position of the carbon plane. (d) Time correlation function of the electrode charge under an applied potential of 0 V.

