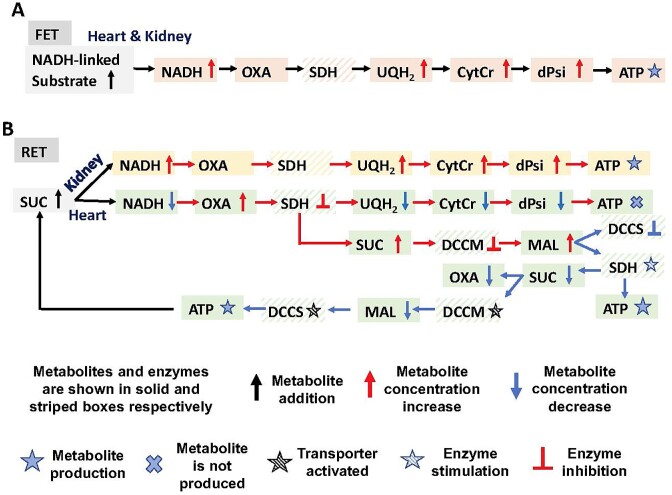
Figure 8.
Schematics of the NADH vs. FADH2 pathway differences and regulations between the heart and kidney cortex and OM mitochondria. The diagram includes metabolites, transporters, and TCA cycle enzymes involved in (A) forward electron transfer (FET) through NADH pathway for the heart and kidney cortex and OM mitochondria in brown and (B) reverse electron transfer (RET) through FADH2 pathway for the kidney cortex and OM mitochondria in yellow and heart mitochondria in green. The black arrows show the control addition or production of metabolites, the red arrows show considerably high increase in concentration of metabolites, and blue arrows show decrease in concentration of metabolites. The solid blue stars show that ATP is produced, and the solid blue multiplication sign show that ATP is not produced. The blue striped stars show that an enzyme or transporter is stimulated, and the black striped stars show that an enzyme or transporter is activated.

