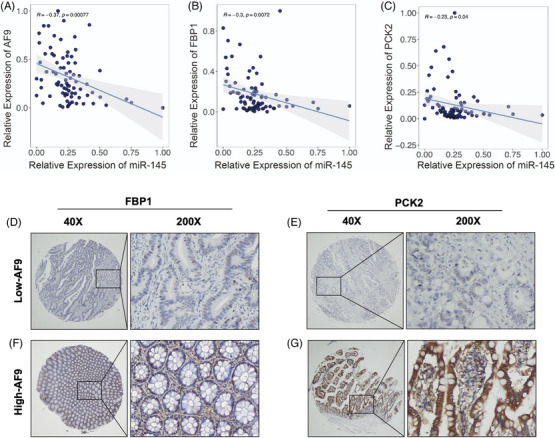
FIGURE 8.

The AF9 expression was significantly associated with miR145, FBP1 and PCK2. (A, B and C) Pearson correlation analysis showing the correlation between miR‐145 and AF9, miR‐145 and FBP1, miR‐145 and PCK2. (D and E) Representative IHC images of FBP1 and PCK2 with high AF9 expression. (F and G) Representative IHC images of FBP1 and PCK2 with low AF9 expression.
