FIG. 4.
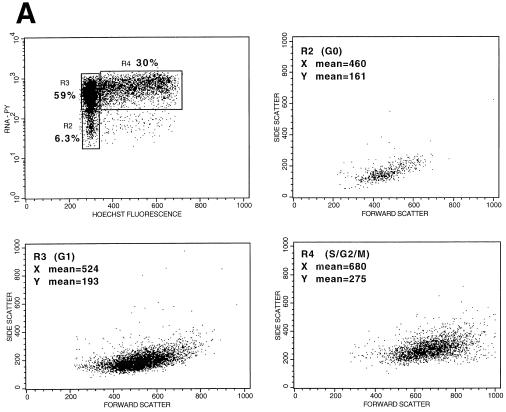
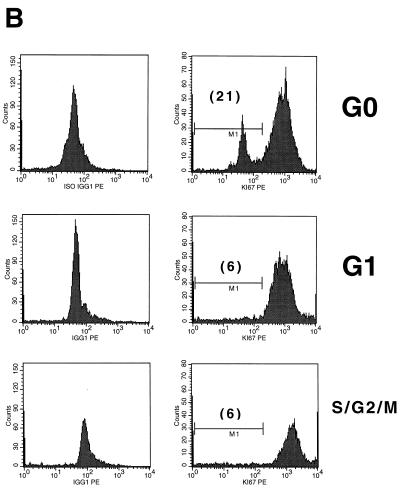
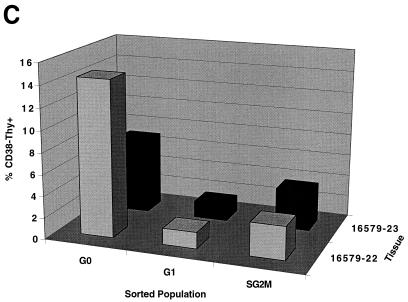
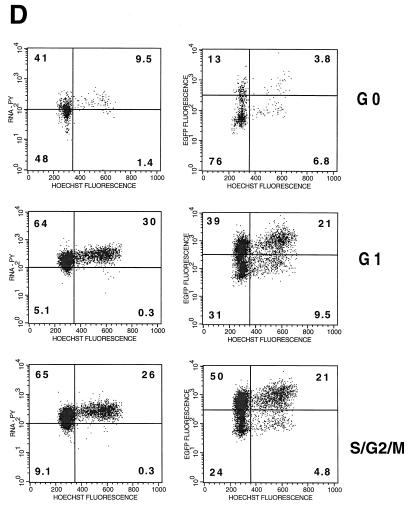
PHSC which have exited G0 are more readily transduced. (A) PHSC were cultured in cytokines for 48 h prior to sorting based on Pyronin Y (PY) and Hoechst 33342 staining. Percentages of each sorted population are shown, along with x and y means for forward and side scatters, respectively. (B) Sorted PHSC were stained by using anti-Ki67–PE (right column) or an isotype-matched control (left column). Only the G0 subpopulation, as defined by Pyronin Y and Hoechst staining had a distinct population of cells that did not detectably express Ki-67. (C) PHSC were sorted based upon Pyronin Y and Hoechst staining, and then each subpopulation was subsequently stained by using anti-lineage–FITC, anti-CD34–TR/SR, anti-Thy–PE, and anti-CD38–APC antibodies, along with appropriate isotype-matched controls. Live cells were gated by exclusion of PI. Results from two independent tissue samples are shown. (D) Sorted populations were transduced overnight with concentrated HIV-eGFP(VSV G) and analyzed 72 h later for enhanced GFP (EGFP) expression, Pyronin Y staining, and Hoechst staining. Quadrant percentages are indicated. Left column, Pyronin Y versus Hoechst; right column, GFP versus Hoechst. Note that for each subpopulation, the S/G2/M population of the transduced cells is two- to fourfold greater than that of the untransduced PHSC. Similar transduction percentages were observed 7 days later.


