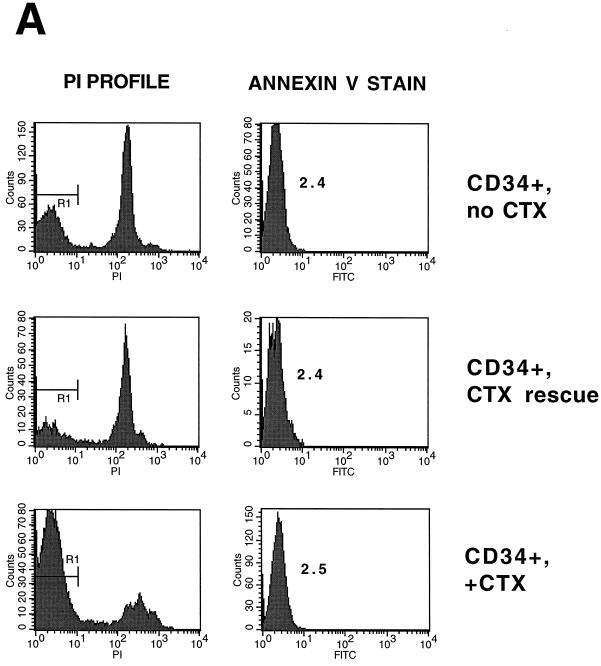
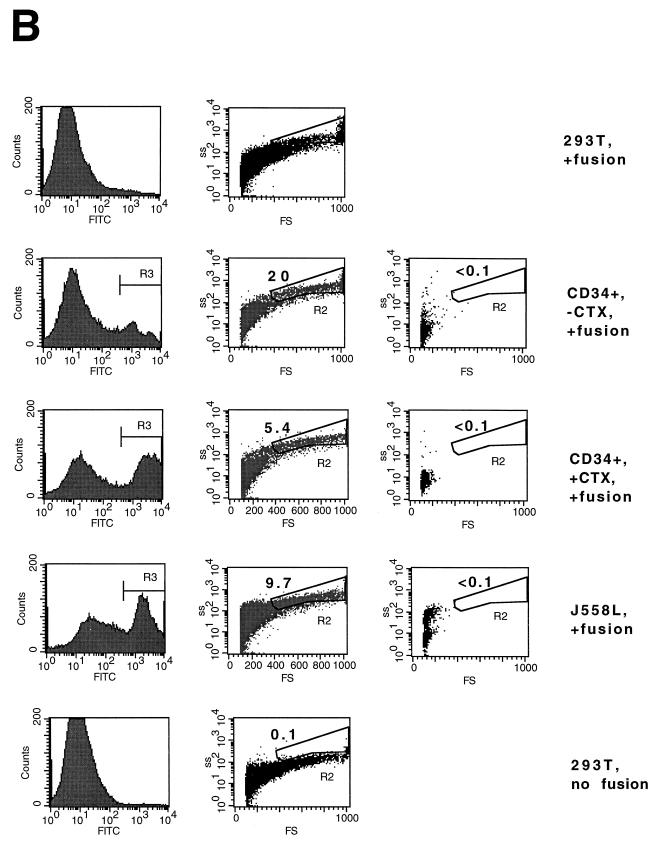
FIG. 8.
The block to transduction in G0 PHSC is at a postentry viral step. (A) CD34+ PHSC were maintained in the presence or absence of cytokines (CTX) or rescued with cytokines. The cells were then stained by using the annexin V Fluos kit (Boehringer Mannheim) and PI. Left column, PI histogram; right column, annexin V histogram. The mean cell fluorescence (MCF) for each PI-negative population is indicated. As expected, the PI-positive populations had a higher MCF (not shown). (B) CD34+ PHSC were maintained in the presence or absence of cytokines, labeled with CFDA-SE, and incubated with VSV G-expressing 293T cells. After acid shock (to promote fusion), cells were analyzed by flow cytometry. Left column, histogram of CFDA-SE fluorescence; middle column, forward-scatter (FS) and side-scatter (SS) dot plot of CFDA-SE-positive cells. The R2 gate includes cells that have undergone fusion (higher forward and side scatters). The percentage of cells is indicated. Right column, forward- and side-scatter dot plot of targets alone. Top and bottom rows, 293T cells alone which have and have not undergone fusion, respectively.


