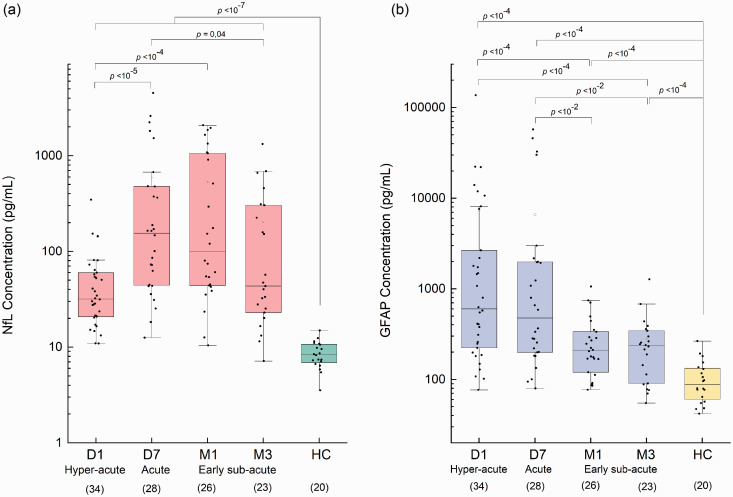
Figure 1.
Trend of sNfL (a) and sGFAP (b) measured in stroke patients (n = 36) at D1, D7, M1, M3 after stroke. The stages of stroke corresponding to the different time-points are reported according to previous literature. 51 The number of patients completing each stage of follow-up is indicated under the x-axis. As reference values, sNfL and sGFAP levels were measured in a group of healthy controls (HC, n = 20). Each box represents the area between the 25th and 75th percentiles [interquartile range, IQR]. Lines inside the boxes represent the median values. White dots represent the mean value for each class. Whiskers extend to the lowest and highest values within 1.5 times the IQR from the box. Statistical analysis was performed by unpaired Mann-Whitney test.

