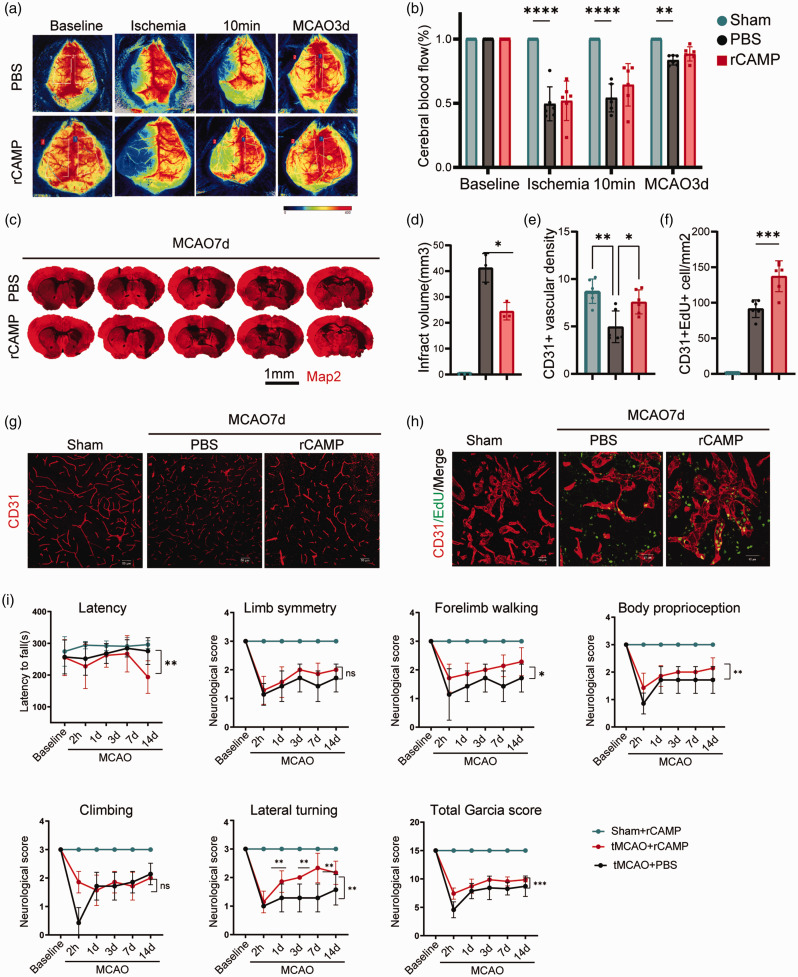
Figure 6.
rCAMP promotes cerebral EC proliferation and neurological repair after ischemic stroke. (a–b) Representative images and quantitative measurements of CBF of mice treated with rCAMP or PBS before MCAO (baseline), during ischemia, 10 minutes and 3d after reperfusion (n = 6 per group, unpaired Student’s t-test). (c–d) Representative MAP2 staining of brain infarct and quantification of infarct volume for PBS or rCAMP treated mice 7 days after MCAO (n = 3 per group, unpaired Student’s t-test). All data are presented as means ± SD, *P < 0.05. (e) Quantification of CD31+ vascular density in the penumbra regions of PBS or rCAMP treated mice 7 days after MCAO or sham surgery (n = 6 per group, one-way ANOVA with Bonferroni multiple comparisons test). (f) Quantification of CD31+ EdU+ cells in the penumbra regions of PBS or rCAMP treated mice 7 days after MCAO or sham operation (n = 6 per group, one-way ANOVA with Bonferroni multiple comparisons test). (g) Representative images of immunofluorescence for CD31+ cerebral endothelial cells in the penumbra regions of rCAMP or PBS treated mice 7 days after MCAO or sham operation. Scale bar, 50μm. (h) Representative confocal images of EdU and CD31 double immunostaining in the penumbra regions of PBS or rCAMP treated mice 7 days after MCAO or sham surgery. Scale bar, 40μm and (i) Sensorimotor function was assessed using Garcia score, rotarod, and foot-fault test for PBS or rCAMP treated mice (n = 6 per group, two-way repeated measures ANOVA and post hoc Dunnett’s test). All data are presented as means ± SD, *P < 0.05, **P < 0.01, ***P < 0.001, ns, no significance.

