Figure 1.
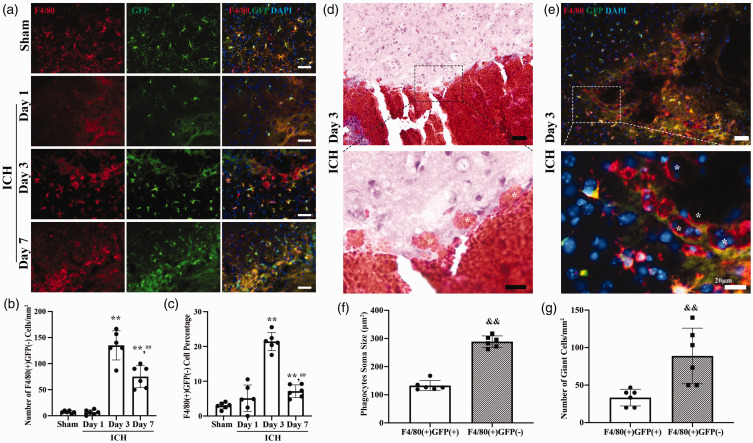
Monocyte-derived macrophages (MDMs) infiltrate the brain and form a cell layer after intracerebral hemorrhage (ICH); (a) Representative image of GFP (green fluorescent protein; green) and F4/80 (red) double staining in the perihematomal area in posthemorrhagic Tmem119-EGFP mice from day 1, day 3, day 7 and sham group mice. Sham mice received a needle insertion. Scale bars are 50 µm. (b) Quantification data on the number of perihematomal F4/80(+)GFP(−) cells (MDMs). (c) Quantification data on the percentage of perihematomal F4/80(+)GFP(−) cells. (d) Representative hematoxylin and eosin stained image of giant cells engulfed red blood cells (indicated with *) around hematoma. High magnification images correspond to the hematoma border. Scale bar is 50 µm in the upper panel, 20 µm in the lower panel. (e) Representative image of MDMs gathering around hematoma and forming giant phagocytes. High magnification images correspond to the hematoma border. * indicates F4/80(+)GFP(−) cells. Scale bar is 50 µm in the upper panel, 20 µm in the lower panel. (f) Quantification data on soma size of perihematomal F4/80(+)GFP(+) and F4/80(+)GFP(−) cells and (g) Quantification data on number of giant cells in perihematomal area. **P < 0.001 vs the sham group, ##P < 0.001 vs 3 days. &&P < 0.001 vs the F4/80(+)GFP(+) cells. Values are means ± SD or median (quartile 1, quartile 3); n = 6 per group.

