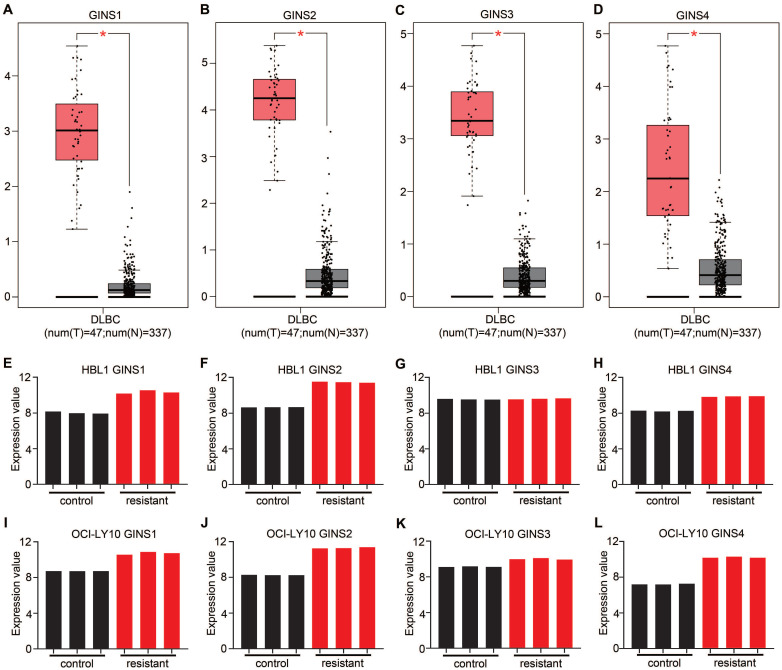
Figure 1.
The mRNA expression of GINS complex and the correlation between GINS expression and drug resistance. Comparative expressions of (A) GINS1, (B) GINS2, (C) GINS3 and (D) GINS4 in DLBCL and normal control tissues by GEPIA. *p-value < 0.05. E-H. Expression of GINS complex in HBL1 parental cells and Ibrutinib resistant cells. I-L. Expression of GINS complex in parental OCI-Ly10 cells and Ibrutinib resistant cells.

