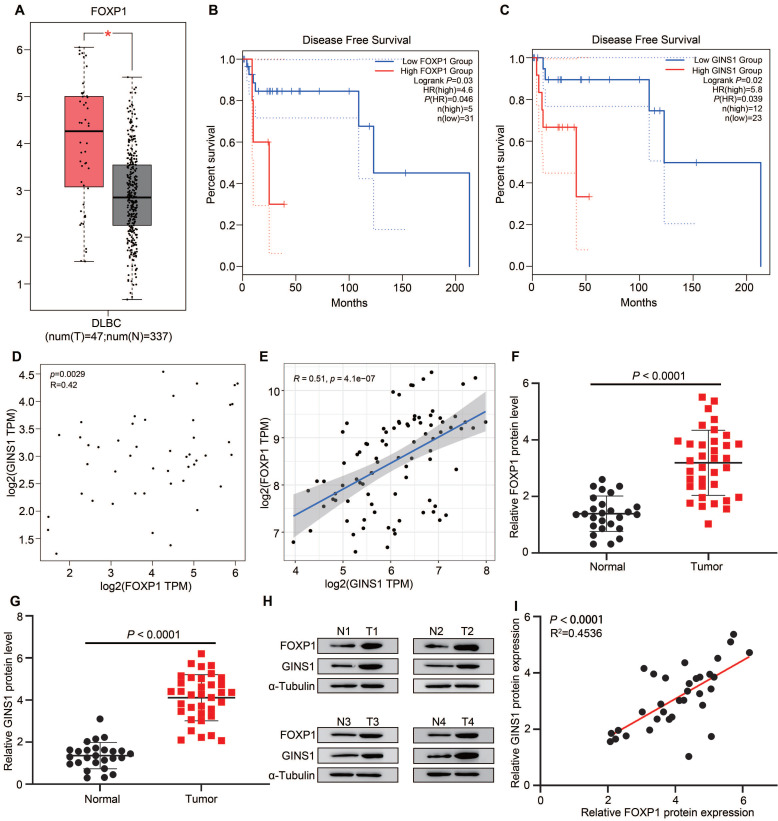
Figure 3.
FOXP1 and GINS1 were both upregulated and correlated in DLBCL specimen. A-D. GEPIA analysis. A. FOXP1 expression in DLBCL tumor. B-C. Statistical analysis of FOXP1 or GINS1 for survival of DLBCL patients. D. The expression correlation of FOXP1 and GINS1 in DLBCL. E. The expression correlation of FOXP1 and GINS1 in GEO datasets GSE93984. F-I. Western blotting analysis of FOXP1 and GINS1 protein expression in our collected DLBCL tissues (T: DLBCL specimens (n=26), N: lymphadenitis patients (n=35). F-G. Western blot analysis. H. Representative western blotting analysis of GINS1 and FOXP1 protein expression. I. Scatter plots show a positive correlation between FOXP1 and GINS1 protein level in DLBCL samples.

