Figure 4.
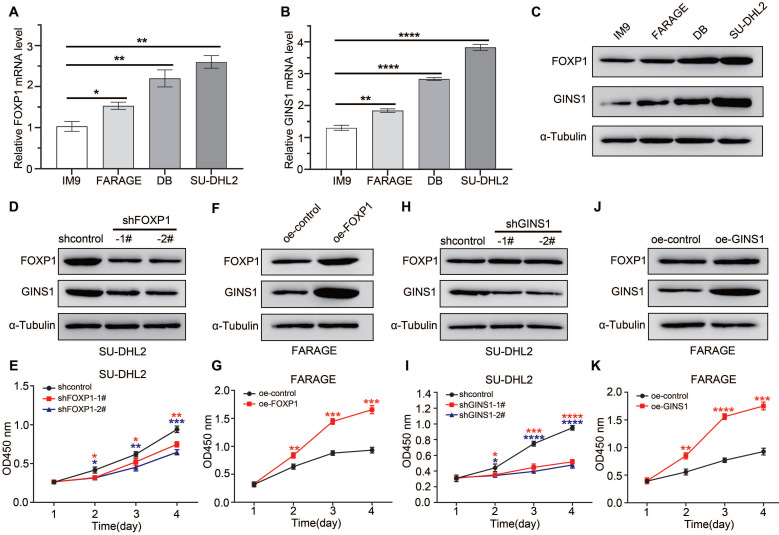
In DLBCL cell lines, FOXP1 expression level influenced GINS1 level, and affected cell growth. A-C. Analysis of GINS1 and FOXP1 expression in DLBCL cell lines. A-B. RT-qPCR analysis. C. western analysis. D. SU-DHL2 cells were infected with control (shcontrol) lentivirus or a lentivirus expressing shRNA for FOXP1. FOXP1 or GINS1 expression level were examined by western. E. CCK8 assay showing knockdown of FOXP1 inhibited proliferation in SU-DHL2 cell. F. FARAGE cells were infected with control lentivirus or lentivirus expressing FOXP1. FOXP1 or GINS1 expression level were examined by western. G. CCK8 assay. H. SU-DHL2 cells were infected with control (shcontrol) lentivirus or a lentivirus expressing shRNA for GINS1. GINS1 expression level were examined by western. I. CCK8 assay. J. FARAGE cells were infected with control lentivirus or a lentivirus expressing GINS1. GINS1 expression level were examined by western. K. Growth curves based on the CCK-8 results.

