Figure 1.
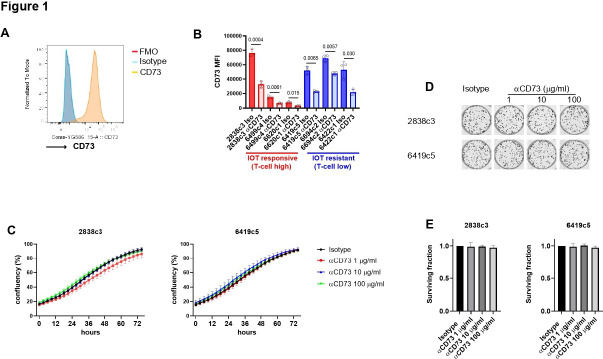
Expression of CD73 on KPCY-derived cell lines and response to anti-CD73 in vitro inhibition. (A) Representative histogram of CD73 expression on KPCY-derived cell line (2838c3) in flow cytometry. (B) CD73 expression was evaluated on KPCY-derived cell lines treated with 10 µg/mL of NIP228 (IgG isotype) or 2c5mIgG1 (anti-CD73 neutralizing antibody) for 24 hours. (C) 2838c3 (left) and 6419c5 (right) cell lines were grown with increasing concentration of anti-CD73 or isotype (100 µg/mL) and confluency was evaluated using Incucyte time lapse imaging for up to 72 hours. For each experiment, three different wells per condition were used per experiment. (D–E) Representative images (D) and graphs (E) showing survival fraction of cells (2838c3 left, 6419c5 right) from the colony-forming experiment following 8-day treatment with anti-CD73 or isotype. For each experiment, three different wells per condition were used. All data are presented as mean±SEM from experiments repeated three times. Statistical analysis was performed with two-tailed unpaired Student’s t-test (B) mixed-effect model (C) and one-way analysis of variance with post-test analysis for multiple comparisons; p values are shown in the graphs when considered significant (p<0.05). IOT, immuno-oncology therapy; FMO, fluorescence minus one; MFI, mean fluorescence intensity.

