Figure 2.

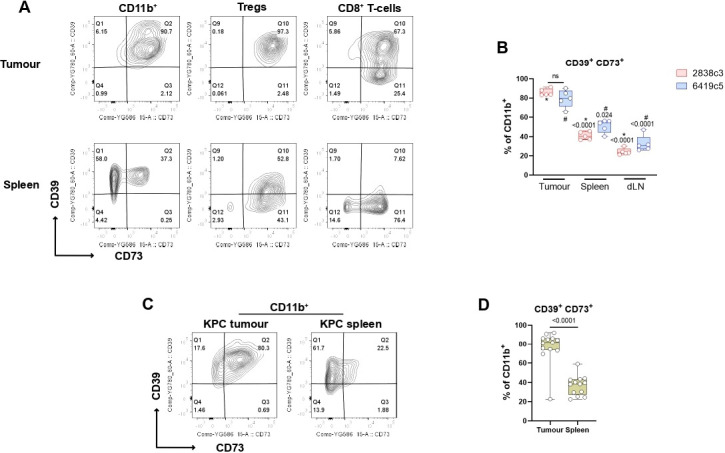
The adenosine pathway members are expressed on PDAC-infiltrating immune cells. (A) Representative flow cytometry plots showing expression of CD39 and CD73 on myeloid population (left), Tregs (middle) and CD8+ T cells (right) from KPCY-cell line derived tumor (upper) and matched spleen (lower) (N=5 mice per group). (B) Box and whisker graph showing CD39+CD73+ double expression on CD11b+ cells for 2838c3 (N=5) and 6419c5 (N=5) in tumors, matched spleens and tumor draining lymph nodes. (C–D) Representative flow cytometry plots (C) and box and whisker graph (D) showing CD39+CD73+ double expression on CD11b+ cells infiltrating autochthonous KPC tumors (N=13). All data are presented as interleaved box and whiskers. Statistical analysis was performed using one-way analysis of variance with post hoc test analysis for multiple comparisons (B) and two-tailed unpaired Student’s t-test (D) p values are shown in the graphs when considered significant (p<0.05). PDAC, pancreatic ductal adenocarcinoma; Tregs, regulatory T cells; dLN, draining lymph node.
