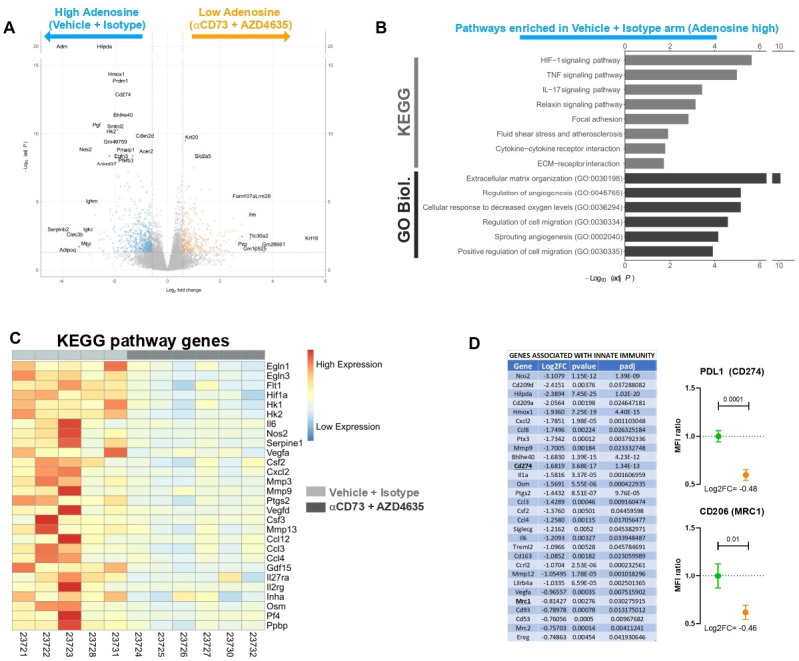
Figure 5.

Adenosine inhibition remodels the pancreatic ductal adenocarcinoma tumor microenvironment. (A) Volcano plot related to 6419c5 allografts. Genes overexpressed in vehicle+isotype arm are on the left side (blue dots), and genes overexpressed in the anti-CD73+AZD4635 arm are on the right side (Adoi, orange dots). (B) Enrichment bar plot of significantly overexpressed pathways in the vehicle+isotype group (adenosine high), according to KEGG and GO biological processes. (C) Heatmap showing genes regulated during treatment (light gray for controls, dark gray for Adoi) which are part of the significantly different pathways according to KEGG. (D) Table (left) showing genes associated with innate immunity that are downregulated by Adoi treatment. Validation of RNAseq data (right graphs) through flow analysis of PD-L1 and CD206 expression (MFI ratio) on intratumoral live cells (8 mice in the control and 10 in the Adoi arms). The samples analyzed for validation were from different mice from the ones used for RNAseq. GO, Gene Ontology; KEGG, Kyoto Encyclopedia of Genes and Genomes; RNAseq, RNA sequencing; PDL1, Programmed death-ligand 1; MFI; mean fluorescence intensity; ECM, extracellular matrix.
