Figure 6.

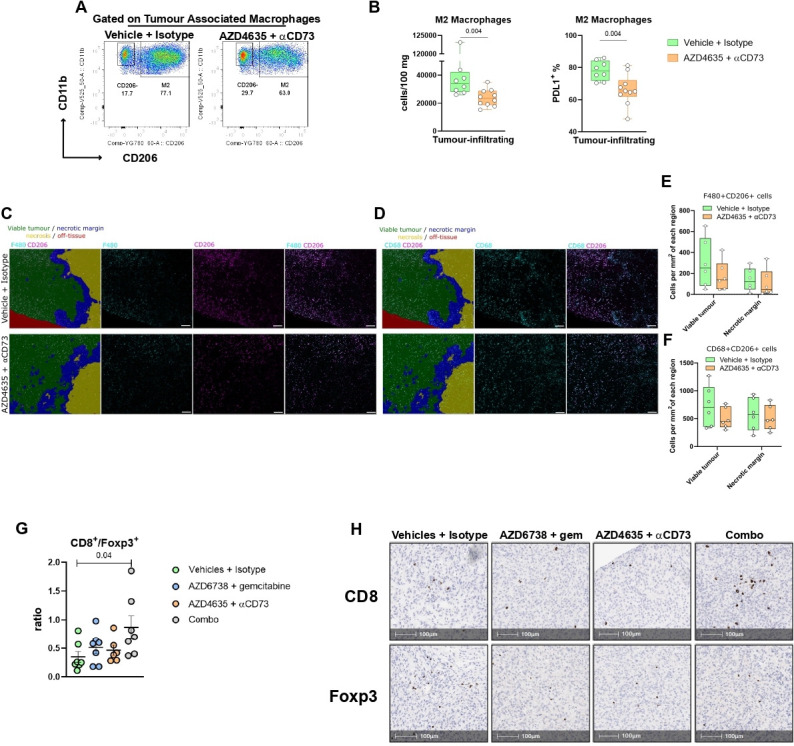
Immunosuppressive immune subpopulations are modulated following adenosine pathway blockade. (A) Representative flow cytometry plots showing tumor associated macrophages infiltrating 6419c5 allografts following 14 days of treatment with vehicle+isotype (left panel) or anti-CD73+AZD4635 (right panel). (B) M2 macrophage allograft infiltration (left, number of cells/100 mg of tumor) and (right) percentage of M2 macrophages positive for PD-L1 (8 and 10 mice per group analyzed). (C–D) Representative IMC image of F4/80 and CD206 (C) and CD68 and CD206 (D) positive cells infiltrating a 6419c5 allograft merged (first panel of C and D) or not with segmentation following Adoi (lower panels) or control (upper). The tissue segmentation of the IMC image was performed by Random Forest Classification using all markers analyzed. The scale bar on the IMC image is 200 µm. Segmentation shows viable tumor (green), necrosis (yellow), necrotic margin (blue) and off-tissue (red). (E–F) The bar plots show cell density (number of cells per mm2) of F480+CD206+ cells (E) and CD68+CD206+ (F) per segment area (six mice per treatment group). (G–H) Immunohistochemistry analysis showing 6419c5 tumor-infiltrating CD8+/Foxp3+ ratio (G) at day 14 of the following treatments: Vehicles+isotype (N=7), AZD6738+gemcitabine (N=7), aCD73+AZD4635 (N=6) and AZD6738+gemcitabine + aCD73+AZD4635 (N=7). (H) Representative immunohistochemistry images of the latter. All data are represented as box and whisker plots. Statistical analysis was performed using Mann-Whitney test (B–H) and one-way analysis of variance with post hoc test analysis for multiple comparisons (E–H) p values are shown in the graphs when considered significant (p<0.05). IMC, imaging mass cytometry; PD-L1, Programmed death-ligand 1.
