

Précis:
This study of inter-test comparability of a novel visual field application installed on an augmented-reality portable headset and Humphrey field analyzer Swedish interactive thresholding algorithm (SITA) Standard visual field test demonstrates the excellent correlation of mean deviation (MD) and mean sensitivity (MS).
Purpose:
To determine the correlation between visual field testing with novel software on a wearable headset versus standard automated perimetry.
Patients and Methods:
Patients with and without visual field defects attributable to glaucoma had visual field testing in one eye of each patient with 2 methods: re:Imagine Strategy (Heru, Inc.) and the Humphrey field analyzer (Carl Zeiss Meditec, Inc.) SITA Standard 24-2 program. Main outcome measures included MS and MD, which were evaluated by linear regression, intraclass correlation coefficient (ICC), and Bland Altman analysis for assessment of the mean difference and limits of agreement.
Results:
Measurements from 89 eyes of 89 patients (18 normal and 71 glaucomas) were compared with both instruments. Linear regression analysis demonstrated an excellent Pearson correlation coefficient of r = 0.94 for MS and r = 0.95 for MD. ICC analysis demonstrated high levels of concordance (ICC = 0.95, P < 0.001 for MS and ICC = 0.94, P < 0.001 for MD). Bland-Altman analysis determined a small mean difference between the two devices (Heru minus Humphrey) of 1.15 dB for MS and 1.06 dB for MD.
Conclusions:
The Heru visual field test correlated well with SITA Standard in a population of normal eyes and eyes with glaucoma.
Key Words: standard automated perimetry, visual field, glaucoma, augmented reality, virtual reality
Static automatic perimeters, such as the Humphrey field analyzer (HFA; Carl Zeiss Meditec, Inc.), are widely used for screening and monitoring glaucoma-related defects. To reduce testing time, the HFA testing strategy has evolved from a full threshold algorithm to the Swedish interactive thresholding algorithm (SITA) that employs Bayesian probability calculations to estimate the expected threshold for adjacent points based on determined threshold values.1 Although validated as a reliable tool,2,3 the HFA has limitations, including the duration of testing, the need for trained technicians, and the cost and size of the device. Moreover, the restricted mobility or positioning capabilities of some patients may impede the successful performance of traditional visual field testing.
To address these limitations, portable alternatives have been developed with recent technology that enables visual field-testing capabilities in less restricted settings. Screening tests administered on a smartphone-powered display and full-threshold applications adapted for a tablet or laptop perimeter make visual field testing possible with widely available digital devices.4–7 Examples include the Melbourne Rapid Fields (M&S) and the Eyecatcher (Eyecatcher), both visual field tests downloaded on tablets. The Melbourne Rapid Fields demonstrated repeatability of tests among patients; however, administering this test requires frequent verbal reminders for fixation maintenance and proper head positioning.5 The Eyecatcher includes a near-infrared remote eye-tracker that monitors patient gaze as they fixate on a dot displayed on the screen; although this test has a good correlation of mean deviation (MD) with the HFA,6 patients reported the lack of surrounding bowl renders the testing environment susceptible to outside distractions.7
Promising alternatives other than laptops and tablets to portable visual field (VF) testing are virtual reality (VR) and augmented reality (AR) head-mounted devices (HMDs). These devices comprise 3 parts: a headset, wireless controller, and portal application. Previous studies compared mean sensitivity (MS) and MD measured using HMDs to the HFA in healthy participants and glaucoma patients.8–10 However, various headset perimeters have limitations that may negatively impact the ease of testing and reliability of the fields generated. Several perimeters have significantly longer mean testing times compared with the HFA, which may increase fatigue.6,10,11 Furthermore, headset weight may impede testing in elderly patients, those with neck injuries, or those with any musculoskeletal limitations.8 Headsets that have a limited range of luminance compared with the HFA may have a higher rate of error in measuring deep visual field defects.11 Despite these limitations, greater patient satisfaction has been reported with portable VF perimeters than with the HFA,7,12 likely related to the less restricted mobility and increased comfort during testing.
In this study, we introduce the Heru re:Vive, a US Food and Drug Administration-registered software platform that uses a commercially available VR HMD with AR capability for visual field testing. The Heru visual field testing strategy, re:Imagine, presents stimuli in a pattern of 54 test locations against a 1 cd/m2 background. This background was selected because it is the dimmest setting on the headset and allows for testing with the maximum dynamic range. Selected initial points establish starting threshold values, then sensitivities of the remaining points are determined throughout the test with a shrinking staircase bracketing strategy. We compare this novel Heru 24-2 test strategy with the HFA 24-2 SITA Standard test to assess the potential for clinical use in evaluating patients with and without glaucomatous visual field defects.
PATIENTS AND METHODS
The Institutional Review Board at the University of Miami Miller School of Medicine and Sterling Institutional Review Board approved the study at the Anne Bates Leach Eye Center (Miami, FL) and Silicon Valley Eye (San Jose, CA), respectively, before patient recruitment. Catherine Johnson, John McSoley, Georgeana Mijares, Abdulla Shaheen, Steven Segarra, Nadine Rady, and Christian Andres Duque were recruited at the Anne Bates Leach Eye Center and Michael Chen was recruited at Silicon Valley Eye. The study adhered to the tenets of the Declaration of Helsinki. Written informed consent was obtained from all patients before enrollment.
Patient Population and Inclusion/Exclusion
We recruited patients from outpatient clinics at the Anne Bates Leach Eye Center/Bascom Palm Eye Institute at the University of Miami Miller School of Medicine and Silicon Valley Eye between June 2021 and November 2021. Patients determined to meet inclusion criteria based on a review of the medical chart were invited to participate during their regular clinic visits. Patients who agreed to participate gave informed consent and were tested during or after their clinic visit. Inclusion criteria included an established diagnosis of glaucoma (primary open angle, closed angle, pseudoexfoliation, and pigmentary) in at least one eye. Patients were included if their clinical examination included a 24-2 SITA Standard examination that day or within 3 months of their Heru visit. Patients without evidence of ocular conditions that might affect the visual field on same-day clinician examination were included as healthy controls.
Eyes with best corrected visual acuities of 20/400 or worse or a history of intraocular surgery within 6 months of study were excluded. Nonemmetropic eyes were tested with the spherical equivalent of the most recent distance prescription inserted into a trial lens holder. Eyes with a spherical equivalent of greater than + 9 or −9 diopters were excluded as the corrective lens was too large to fit in the headset. If patients had one eye that met either of the exclusion criteria, the other eye was tested if it satisfied the inclusion requirements. If both eyes are qualified, then one eye, assigned with a randomization table, was selected for inclusion in the study analysis.
Eyes with glaucoma were stratified by disease severity according to the MD of their most recent 24-2 SITA Standard test, with MD > −6.01 dB signifying mild, MD of −6.01 to −11.99 dB signifying moderate, and MD < −11.99 dB signifying severe disease.13 Of the 71 eyes with glaucoma, 41 were mild, 13 were moderate, and 17 were severe.
Test Procedures
Participants underwent 24-2 re:Imagine visual field testing on the re:Vive platform (Heru, Inc.) with the Magic Leap 1, size 2, wearable AR HMD (Magic Leap, Plantation) in one or both eligible eyes depending on clinic and participant schedule and availability (Fig. 1). If the participant had a reliable SITA Standard 24-2 test within 3 months of the Heru test, then the values from the most recent HFA test were used for comparison. If patients were scheduled for an HFA on the same day as the study visit, the HFA field was obtained either before or after the study visit depending on clinic flow and patient availability. All participants had previously been tested with Static automatic perimeter or frequency doubling technology and participated in the short Heru interactive training session presented on the HMD before starting the test.
FIGURE 1.

A patient wearing the HMD with the light shield mounted to prevent light leakage.
Heru re:Imagine Visual Field Test
The hardware and testing strategies of the Heru visual field test differ from the HFA SITA Standard test (Table 1). The HFA testing strategy projects white light onto the surface of a perimetry bowl illuminated at 10 cd/m2. The Heru re:Imagine strategy uses an HMD to present a white stimulus on a virtual background with a luminance of 1 cd/m2. The luminance curve for the wearable headset is similar to other projection devices10 and has a maximum luminance of 210 cd/m2 and a minimum of 1 cd/m2.
TABLE 1.
Specifications for Both Devices Used in the Study
| Device aspect | HFA 24-2 SITA Standard | Heru 24-2 re:I Threshold |
|---|---|---|
| Hardware | Perimetry bowl (30 cm) | Magic leap 1, size 2, waveguide high-resolution display (1.3 megapixels per eye) |
| Hardware weight (g) | 28,700 g (HFA 3) | Headset with a light shield: 361 g Connected light pack: 425 g |
| Stimulus | Projected white light | White light displayed on dark AR background |
| Stimulus size | Goldman size III | Dynamic, with a maximum of Goldman size III |
| Background illumination (cd/m2) | 10 | 1 |
| Brightest stimulus intensity (cd/m2) | 3183.1 | 210 |
| Source of sensitivity differences | Luminance | Contrast |
| FOV (horizontal×vertical) | 60 degrees×60 degrees | 40 degrees×30 degrees. 24-2 achieved by moving the fixation target |
| Gaze control | Blind spot monitoring, optional ability to monitor and report on gaze | Active real-time eye tracking (60 Hz), blind spot monitoring |
| Ambient light control | Dark room | None required |
| Test pattern | 24-2 | 24-2 |
| Test strategy | SITA Standard | re:I Threshold |
| Stimulus duration (msec) | 200 | 200 |
| Testing distance | 30 cm | Infinity |
| Fellow eye patched | Yes | No |
| Reliability indices (%) | FP, FN | FP, FN |
| Refractive correction | Trial lenses | Trial lenses |
AR indicates augmented reality; FN, false negative; FOV, field of view; FP, false positive; HFA, Humphrey field analyzer; SITA, Swedish interactive thresholding algorithm.
As part of the AR feature of the headset, the display is a light waveguide that projects images from a micro-liquid crystal display inside the headset with the principle of total internal reflection. The micro-liquid crystal display driving the waveguide of the display optics is susceptible to a “light bleeding” phenomenon. This effect causes stimuli with higher brightness to spread farther than expected on the display, which may cause the stimulus to “bleed” into testing areas of neighboring stimuli locations, specifically appearing larger than expected and resulting in higher false positive (FP) responses. To overcome the light bleeding effect, we designed a testing algorithm that reduces the stimulus size according to the designated testing decibel value to maintain an effective size III stimulus on the display. Based on our display measurements, we determined that stimuli of 23 dB were equal in size to the standard Goldmann size III without bleeding; dB values lower than 23 dB showed varying light bleeding effects. The stimulus size was gradually reduced by an average factor of 2 to minimize the bleeding curve for dB values <23 dB. To maintain the contrast curve for stimuli >23 dB, the stimulus size was reduced by an average factor of 3. Although this dynamic stimulus size could introduce a new source of variability, we noted that the area of spatial summation has been shown to vary with multiple factors including background luminance,14 eccentricity,15 and pathology.16 Thus, in this setting, a reduction in stimulus size expands the dynamic range where the stimulus intensity is limited.
Unlike the HFA, which requires patching the untested eye, Heru visual field testing stimulates eyes individually on 2 separate screens and does not require patching. Each eye is tested independently, with the full test administered to one eye before proceeding to the fellow eye. The Heru thresholding strategy estimates starting sensitivities based on 4 seed points in each of the 3 concentric zones. A shrinking staircase strategy with a starting step size of 3 dB and a final step size of 1 dB is then applied independently to bracket each point for the determination of the final threshold at each location within a target precision of 1 dB. The thresholding algorithm is the same for all points in the Heru test. The primary point step sizes are different between the Heru test and the HFA—3 dB compared with 4 dB initially, and 1 dB compared with 2 dB for final precision, but the variability of individual points in visual field testing is larger than both final target precision values.17 Therefore, this difference is not expected to have a substantial effect on the accuracy or precision of the Heru test. All 54 points of the 24-2 test pattern are tested with both devices.
The Heru report includes a VF grayscale plot and presents MD, total deviation, pattern deviation, and reliability indices composed of FPs, false negatives (FNs), and fixation losses (FL). The deviations are calculated on an unpublished reference database of both eyes of 80 patients with normal vision, ages 20–80, binned into decades, with even distribution across bins that were independently collected before this study was done.
Reliability Indices
The re:Vive platform uses an active eye tracking system (Heru ActiveTrack to monitor fixation. During the re:Imagine VF test, infrared light-emitting diode and an infrared camera in the HMD determine individual gaze coordinates at a frequency of 60 Hz. Stimuli are presented when the patient is properly aligned, and the Heru application will prompt the patient to regain fixation by wiggling the target if fixation is lost. If the system is unable to provide active eye tracking, the testing strategy converts to a method similar to the HFA, where a bright stimulus of 4 dB is randomly displayed approximately every 20 presentations into the previously confirmed blind spot. The designated blind spot is the first of 5 common blind spot locations tested to have no patient response. Subsequently, if the patient responds to a presentation at the blind spot, it is recorded as an FL. The operator monitors the test and patient fixation in real-time through the Heru web-based portal. The VF report displays the method of fixation monitoring (ie, ActiveTrack) or, in the case of blind spot monitoring, the number of FL over the total number of catch trials.
For Heru, the percentages of FP responses and FN responses are generated based on the patient response in comparison to the known threshold stimulus value. An FP response is recorded if the patient responds to a subthreshold stimulus (dimmer) when 9 dB is added to the previously established threshold value. An FN response is recorded if the patient fails to respond to a suprathreshold (brighter) stimulus when 9 dB is subtracted from the known threshold value. This is comparable to the method initially described for the HFA Full Threshold program.18 Reliability indices are estimated based on these “catch trials” that are presented approximately once every 20 presentations for each type (FN, FP, and FL). The HFA SITA Standard designates an FP when a patient responds too quickly, <200 ms to a stimulus, or responds in the absence of a stimulus. In SITA tests, FPs are evaluated and reported at the end of the test and a percentage of >15% is indicated by a double X. The HFA differs from the Heru in that the HFA does not test for FNs in areas of low sensitivity. We recorded and compared the FL, FP, and FN distributions from both tests.
Testing Conditions
To limit the ambient light entering the perimetry bowl, HFA tests were performed in a dark room. Heru tests used a light shield mounted onto the device to block ambient light, allowing the tests to be performed in typical office conditions (Fig. 1).
The testing distance of the 2 systems is different. TheHFA testing distance, 30 cm, requires 3.3 diopters of accommodation, and optical correction is based on patient age and refractive error. The Heru HMD presents the stimuli at optical infinity and requires only the distance correction. A trial lens holder, mounted within the Heru headset, provides optical correction, spherical equivalent, of the distance refractive error.
A summary of the differences between the two devices is shown in Table 1.
Test Review
An optometrist (J.M.) experienced in evaluating perimetric tests reviewed independently in a masked manner device reports for all HFA and Heru visual fields. The two tests for each eye were reviewed at different times and without knowledge of the other assessment. For each field, the presentation included the relevant diagnoses, visual acuity, and distance refractive error. The review considered the reliability parameters, gaze information, and presence of artifacts in visual field testing. Participants were excluded based on visual fields that had one or more of the following characteristics: HFA FL >25% (n = 9), HFA FPs >33% (n = 4), HFA FNs >33% (n = 4), apparent artifacts, such as edge artifact or cloverleaf patterns, superior depression consistent with interference from the eyelid, or sensitivity values high enough to produce a pattern deviation more abnormal than a total deviation (n = 6). Three patients had HFA fields with catch loss fixation monitoring above 25% but had normal gaze tracking profiles and were not excluded. Most tests were excluded based on multiple above criteria; only one test with acceptable reliability parameters was judged to have an artifact (positional, creating an edge defect).
Statistical Analyses
We evaluated the correlation with linear regression and mean difference and limits of agreement with Bland-Altman analysis for MS, calculated as the average of 52 nonblind-spot points, and MD. Linear correlation values were calculated for pattern SD (PSD). The intraclass correlation coefficient (ICC) estimates and their 95% CIs were calculated with SPSS statistical package 26 (SPSS Inc.) with an absolute agreement, 2-way mixed-effects model. Of the CIs, 95% were determined and P values of <0.05 were considered statistically significant. We report Pearson correlation, ICC, and Mann-Whitney U test, P values comparing parameters of MD, MS, and PSD for each subgroup of normal eyes and glaucomatous eyes. FN, FP, and FL values were compared with the Mann-Whitney U test. We conducted the Shapiro-Wilk test to evaluate for normality before performing the statistical significance tests.
We recruited patients with a range of disease severity, including those with normal visual fields and patients with mild, moderate, and severe glaucomatous loss. The CI for R 2 is determined from the SE according to this formula:
Our goal was to have confidence limits of ± 5%.19
RESULTS
Demographics and Characteristics of Included Data
Of 226 outpatients invited to participate in the study, 185 agreed and 41 declined to participate. Of the 185 participants, all successfully completed testing. Of these, patients who were willing and able to complete Heru testing during their regularly scheduled clinic visit, and whose comparison test was SITA Standard, were included. Eighty-three (83) participants were excluded because they did not have a SITA Standard test within 3 months. We excluded one patients with a nonglaucomatous cause of vision loss (N = 1). The independent review of fields eliminated 12 eyes based on reliability indices or artifacts in the HFA (8 eyes), in the Heru field (3 eyes), or both (1 eye). Of the 89 eyes, all patients had taken a visual field test before the study. In 8 patients, the HFA was from a prior visit. Of the patients with same-day HFA testing, 50 patients underwent Heru testing after the HFA and the remaining 31 patients underwent Heru testing before the HFA. The 89 paired Heru and HFA field printouts for all participants are displayed in the Appendix (Supplemental Digital Content 1, http://links.lww.com/IJG/A789).
Demographics and refractive errors for both groups were comparable (Table 2). The patients with normal eyes were younger and had larger refractive errors. Most patients in both groups had either no or low refractive errors. Nine myopic eyes had a refractive error spherical equivalent < −4 diopters and 2 hyperopic eyes had spherical equivalent > +2 diopters. Eight patients (8 eyes) had the best corrected visual acuities of worse than 20/40: 2 eyes = 20/200, 1 eye = 20/100, 4 eyes = 20/60, and 1 eye = 20/50.
TABLE 2.
Demographics for Both Populations Included in the Study and Breakdown by Glaucoma Severity
| Demographic information | Glaucoma eyes | Normal eyes |
|---|---|---|
| N | 71 | 18 |
| Age | 67 (12) Range: 33, 88 |
37 (12) Range: 18, 60 |
| Sex | Female: 35 Male: 36 |
Female: 10 Male: 8 |
| Refractive error: sphere | Mean (SD): −0.76 (1.82) Range: −9.00, 2.25 |
Mean (SD): −1.81 (3.04) Range: −7.00, 0.75 |
| Refractive error: Cyl | Mean (SD): +0.77 (0.90) Range: −2.00, 3.50 |
Mean (SD): −0.86 (0.81) Range: −2.25, 0.00 |
| Refractive error: SE | Mean (SD): −0.37 (1.90) Range: −8.50, 2.38 |
Mean (SD): −2.24 (3.21) Range: −7.00, 0.63 |
| Best-corrected visual acuity (in logMAR) | Mean (SD): 0.15(0.21) | Mean (SD): 0 |
| SITA Standard MD | Mean (SD): −6.7 (7.5) Range: −28.1, 0.32 |
Mean (SD): −0.14 (0.95) Range: −1.58, 2.35 |
| Glaucoma severity (based on HAP criteria) [19] Glaucoma severity (based on C/D ratio), number of glaucoma medications, and RNFL thickness are reported as mean (SD) |
Mild (MD ≥−6 dB): 41 Mean IOP: 15.90 (3.09) Mean C/D: 0.59 (0.19) Mean number of glaucoma meds: 1 (1.3) Mean RNFL thickness: 82.05 (13.91) |
NA |
| Moderate (−6 dB < MD ≥ −12 dB): 13 Mean IOP: 13.84 (2.91) Mean C/D: 0.78 (0.12) Mean number of glaucoma meds: 2.38 (1.39) Mean RNFL thickness: 61.77 (9.72) |
||
| Severe (MD < −12 dB): 17 Mean IOP: 11.94 (2.25) Mean C/D: 0.89 (0.06) Mean number of glaucoma meds: 2.53 (1.28) Mean RNFL thickness: 67.06 (10.50) |
C/D indicates cup-to-disc; IOP, intraocular pressure; MD, mean deviation; NA, not available; RNFL, retinal nerve fiber layer; SITA, Swedish interactive thresholding algorithm.
Reliability Indices
For Heru reporting, FLs only apply to the portions of the test when ActiveTrack converts to blind spot monitoring. Therefore, in 31 eyes FLs were not measured because fixation was retained throughout the exam. For the 58 eyes where blind spot monitoring occurred, 35 eyes had no FLs, 14 had one, and 9 had more than one. For HFA, the results were similar. Thirty-one (31) eyes had no FLs, 27 with one FL, and 31 with more than one (Table 3). As the Shapiro-Wilk test failed to demonstrate the normality of distribution, we used the nonparametric statistical testing methods. There was no statistically significant difference between Heru mean FL [median 0, interquartile range (IQR) = 0–0.33] and HFA mean FL (median 0.07, IQR = 0–0.14) (P = 0.47, Mann-Whitney U test).
TABLE 3.
FL Observed in HFA and Heru Examinations for all Examinations
| FL (P = 0.468) | HFA | Heru |
|---|---|---|
| NA | — | 31 |
| 0 | 31 | 35 |
| 1 | 27 | 14 |
| 2 | 16 | 4 |
| 3 | 6 | 2 |
| 4 | 5 | 2 |
| 5 | — | 1 |
| 7 | 1 | — |
| 10 | 1 | — |
| 11 | 1 | — |
| 12 | 1 | — |
P value reflects comparisons of measurements, Mann-Whitney U test.
FL indicates fixation losses; HFA, Humphrey field analyzer; NA, not available.
The distributions of FPs and FNs are shown in Table 4. For HFA, 74 eyes had FP <5%, and for Heru, 67 had FP of 0%. Both devices had 54 eyes with 0% FN. Therewas no statistically significant difference between Heru mean FN (median 0, IQR = 0–0.2) and HFA mean FN (median 0, IQR = 0–0.06)(P = 0.50), and on average, Heru FP (median 0, IQR = 0–0) was higher than HFA FP (median 0.01, IQR = 0.01–0.04) (P < 0.001, Mann-Whitney U test).
TABLE 4.
FPs and FNs Observed (n = no. eyes) in HFA and Heru Examinations
| FN% (P = 0.05) | FP% (P < 0.001) | |||
|---|---|---|---|---|
| Percentages of FN and FP | HFA | Heru | HFA | Heru |
| 0 | 55 | 53 | 22 | 69 |
| 1–9 | 23 | 0 | 62 | 0 |
| 10–19 | 8 | 10 | 5 | 13 |
| ≥20 | 2 | 26 | 0 | 7 |
| NA | 1 | 0 | 0 | 0 |
P values reflect comparisons of all measurements of FNs and FPs, Mann-Whitney U test.
FN indicates false negative; FP, false positive; HFA, Humphrey field analyzer; NA, not available.
Mean Sensitivity Comparison
MS from the Heru examinations is plotted against the MS from the same points on the HFA (Fig. 2A). Linear regression analysis demonstrates excellent correlation, r = 0.95. Bland-Altman analysis that plots the difference (HFA minus Heru) versus the mean of the two in Figure 2B demonstrates a small mean difference between the two devices of 1.2 dB (limits of agreement −6.0 dB to 3.7 dB), with Heru demonstrating a higher sensitivity, and little variation across the dynamic range. The ICC value is 0.97 (95% CI of 0.94, 0.98), indicating excellent reliability.20 Subgroup analysis of normal eyes and eyes with mild, moderate, and severe glaucoma demonstrates good overall agreement in severe eyes (ICC = 0.83) and mild eyes (ICC = 0.75) and weaker agreement in normal eyes (ICC = 0.45) and moderate eyes (ICC = 0.43) (Table 5).
FIGURE 2.
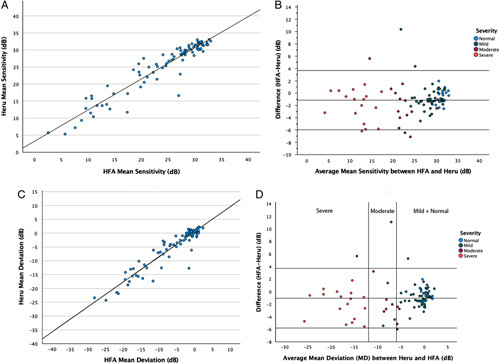
Plots showing the correlations between HFA and Heru of MS and MD. A, Linear regression plot of Heru MS versus HFA MS (in dB). B, Bland-Altman plot showing the difference in MS between devices as a function of the average sensitivity (in dB). C, Linear regression plot of Heru MD versus HFA MD (in dB). D, Bland-Altman plot showing differences between Heru MD and HFA MD (in dB). The 2 vertical orange lines stratify by the severity of disease based on HAP criteria19 (Left: mild or no disease (MD ≥ −6 dB); middle: moderate disease (−6 dB > MD ≥ −12 dB); right: severe disease (MD < −12 dB). HFA indicates Humphrey field analyzer; MD, mean deviation; MS, mean sensitivity.
TABLE 5.
Comparison of MD, MS, and PSD for all eyes and all Subgroups of Normal Eyes and Eyes With Glaucoma (mild, moderate, and severe)
| MD | MS | PSD | |||||||
|---|---|---|---|---|---|---|---|---|---|
| ICC (95% CI) | Pearson correlation, r | P | ICC (95% CI) | Pearson correlation, r | P | ICC (95% CI) | Pearson correlation, r | P | |
| Overall (n = 89) | 0.965 (0.935 to 0.980) | 0.943 | 0.080 | 0.967 (0.935 to 0.981) | 0.947 | 0.170 | 0.927 (0.889 to 0.952) | 0.890 | 0.065 |
| Normal (n = 18) | 0.381 (−0.294 to 0.742) | 0.313 | 0.019* | 0.451 (−0.293 to 0.784) | 0.325 | 0.104 | 0.026 (−0.447 to 0.481) | 0.026 | <0.001* |
| Mild (n = 41) | 0.636 (0.324 to 0.805) | 0.494 | 0.068 | 0.746 (0.524 to 0.864) | 0.628 | 0.060 | 0.554 (0.155 to 0.764) | 0.463 | 0.001* |
| Moderate (n = 13) | 0.479 (−0.374 to 0.828) | 0.536 | 0.014* | 0.431 (−0.445 to 0.809) | 0.463 | 0.014* | 0.509 (−0.258 to 0.837) | 0.488 | 0.072 |
| Severe (n = 17) | 0.862 (0.335 to 0.959) | 0.848 | 0.106 | 0.827 (0.330 to 0.944) | 0.799 | 0.140 | 0.678 (0.004 to 0.890) | 0.673 | 0.049* |
Statistically Significant P value is less than the cutoff of 0.05.
ICC indicates intraclass correlation coefficient; MD, mean deviation; MS, mean sensitivity; PSD, pattern SD.
Mean Deviation Comparison
The linear regression of the MD from the Heru exams against the MD from the HFA SITA Standard examinations demonstrates excellent correlation, r = 0.94 (Fig. 2C). Bland-Altman analysis for MD that plots the difference of HFA minus Heru against the mean of the two shows a small difference of 1.1 dB (limits of agreement: −5.8 dB to 3.7 dB), with Heru showing slightly higher sensitivity and with minimal variation across the dynamic range (Fig. 2D). The ICC value is 0.97 (95% CI of 0.94, 0.98), indicating excellent reliability.20 Subgroup analysis shows good overall agreement in severe eyes (ICC = 0.86) and weaker agreement in mild eyes (ICC = 0.64), moderate eyes (ICC = 0.48), and normal eyes (ICC = 0.38) (Table 5).
Pattern SD Comparison
The linear regression of the PSD from the Heru examinations plotted against the PSD from the HFA SITA Standard examinations demonstrates a fair correlation of r = 0.89. The ICC value is 0.93 (95% CI of 0.89, 0.95), indicating excellent reliability.20 Subgroup analysis shows weak agreement among all groups: severe eyes (ICC = 0.68), mild eyes (ICC = 0.55), moderate eyes (ICC = 0.51), and normal eyes (ICC = 0.03).
Individual Test Points
The Heru and HFA examinations from the same eye of 4 patients are shown in Figure 3. The regression plot of individual test points from Heru versus the same test points from HFA for all included examinations is pictured in Figure 4. Comparison between the corresponding testing points in Heru and HFA VF measurements are statistically significant, Pearson linear correlation (r = 0.81, P < 0.001, 95% CI of 0.81, 0.83). Pearson correlation coefficients were calculated for each of the 52 nonblind spot points tested which ranged from 0.66 to 0.93 (P < 0.05) and we also report pointwise correlation coefficients for each group of normal, mild, moderate, and severe eyes (Fig. 5).
FIGURE 3.

Four examples of Heru tests compared with HFA tests from the same eye. Top left (ID 860): 61-year-old man with pigmentary glaucoma—on 3 glaucoma medications with a C/D of 0.7 and mean RNFL of 55 µ. Top right (ID 876): 63-year-old man with uveitic glaucoma—on 1 glaucoma medication with a C/D of 0.9 and mean RNFL of 81 µ. Bottom left (ID 870): 59-year-old man with anatomic narrow-angle—on no glaucoma medications without glaucomatous optic neuropathy. Bottom right (ID 930): 80-year-old man with normal tension glaucoma—on 4 glaucoma medications with a C/D of 0.95 and mean RNFL of 64 µ. C/D indicates cup-to-disc; HFA, Humphrey field analyzer; RNFL, retinal nerve fiber layer.
FIGURE 4.

Linear regression plot of 4628 individual test points (Heru vs HFA). The 2 points contiguous with the blind spot have been omitted for both tests. Points in the plot may represent more than one individual test point. HFA indicates Humphrey field analyzer; SITA, Swedish interactive thresholding algorithm.
FIGURE 5.

Pearson correlation coefficient (r) between Heru and HFA tests for nonblind spot pointwise threshold values: (A) for all participants, (B) for healthy eyes, (C) for mild eyes, (D) for moderate eyes, and (E) for severe eyes. Correlation values of <0.40 are highlighted in red. HFA indicates Humphrey field analyzer.
DISCUSSION
We demonstrated that the results of a novel software algorithm to perform visual field testing, implemented on a wearable AR device, are strongly correlated across the dynamic range with those obtained on a conventional device. The mean sensitivities of the HFA SITA Standard and Heru re:Imagine visual field tests correlate significantly, with a strong linear trend and an excellent correlation coefficient and ICC value. Bland-Altman analysis demonstrates good overall limits of agreement with a small difference in MS of −1.2 dB. Of note, >5% of points (6 eyes) lie outside the limits of agreement in Figure 2B, indicating a significant number of outliers with respect to MS. Of these 6 eyes, 3 are in the moderate glaucoma subgroup, 2 are mild, and 1 is severe. The MD and PSD also correlate strongly between both tests, indicating that the Heru VF test yields comparable results of absolute values and overall depression of the visual field.
Subgroup analysis of correlation values for MD, MS, and PSD was generally weaker compared with the overall values. Stronger correlations were demonstrated among the severe glaucoma subgroup across all parameters whereas weaker correlations were seen among moderate glaucoma and normal eyes. Prior studies have demonstrated increased variability of midrange sensitivities between 26 dB and 10 dB, below which variability decreases due to the limited dynamic range of the perimeter.21,22 This floor effect likely accounts for the much higher correlation values seen in this study among the severe subgroup compared with the moderate. The low correlation values among normal eyes are likely attributable to the small dynamic range of their high sensitivity values. This impacts the accuracy of the linear correlation analysis and does not necessarily reflect the low measurement accuracy of the test.
The scatter in individual test points is typical of comparison among visual field examination points, as reported by Wall et al.17 As Wall et al17 show multiple varieties of perimetry,the subjective nature of visual field testing leads to a high variability on a retest of sensitivity at individual points. A study by Goukon et al23 comparing another VR headset field test, the IMO (CREWT Medical Systems, Inc., Tokyo, Japan), to the HFA shows a similar scatter of plotted sensitivities. The overall correlation coefficients (r) for pointwise sensitivities between Heru and HFA tests were moderate to strong. However, subgroup analysis: normal and mild, moderate, and severe glaucoma demonstrated several scattered points with poor correlation (r < 0.40).
Recent studies of other HMDs have also evaluated the comparability of these devices to the HFA for MS or MD, but rarely both.8,10 Unlike previous studies, we evaluated both MD, MS, and PSD comparability between a wearable device and the HFA. The HMD visual field test evaluated in the Razeghinejad et al 201910 study has a global MS correlation to the HFA of 0.8 in glaucoma patients in comparison to our higher reported correlation of Heru re:Vive to HFA of 0.9 (r = 0.95).10 We purposely recruited patients with a wide range of glaucoma severity evidenced by visual field loss. The range of patients tested in the Razeghinejad and colleagues study falls within the mild to moderate range of glaucoma, with 2 patients having a MS <15 dB, whereas our analysis included eyes demonstrating a wider range of disease and pathology, including more than 15 patients with MS below 15 dB.
The distribution of reliability indices varied between the two devices, but in general, most tests on both devices showed low FL, FN, and FP. The reliability indices in both devices can, therefore, be used to better understand patient performance during the test. Higher percentages are reported with fewer instances of clicking errors and the specific non-zero values are larger. The evidence on whether these indices are effective to judge test reliability is uncertain. One study found FL to have little to no significant association with variability.24 Another found the HFA gaze tracking index to be more predictive of the reliability of a field.25 Other studies have reported that FP frequency significantly affects MD,24 affects sensitivity,26 or has no significant effect on VF reproducibility.27 For some patients, Heru FPs were significantly higher than for HFA. This may be related to differences in how the devices measure FPs, but it may also relate to the novelty of the device. Future studies are required to establish the best criteria for including and excluding data based on Heru reliability indices.
Several methodological considerations may limit the generalizability of our study. Although efforts were made to space testing between the Heru and HFA visual fields, occasionally time constraints required participants to undergo Heru testing immediately after HFA completion or vice versa. Given the impact of patient fatigue on visual field testing, completing 2 consecutive tests may undermine reliability and contribute to a more negative MD and lower MS than expected in the second test performed.3,28 However, among the subset of patients who performed consecutive testing, an interval of time between tests was taken to walk participants between test locations and to obtain informed consent. A perimetric learning effect may also occur, in which sensitivity improves with subsequent testing,29 although a confounding effect of test order is likely small based on the variable timing of patient recruitment during their clinic visit. Of patients undergoing same-day Heru and HFA testing, 56 had undergone HFA testing first and 36 had undergone Heru testing first. We selected reliability criteria of <33% for HFA FPs and FNs that are less stringent than those used in some studies validating new visual field parameters, which may be as low as 20%.11,30 We applied higher cutoffs to facilitate the recruitment of eyes with a wide range of glaucoma severity with the understanding that this may impact correlation findings. However, only 1 additional patient (FN% = 33) would have been excluded if the FN and FP cutoffs were changed to 25%, and the impact on the reported correlations would be minimal.
The technological characteristics of the Heru visual field test are substantially different from those of the HFA, reflecting different means of achieving the dynamic range needed for human visual function testing that can cause inaccurate measurements for too bright or too dim stimuli. Heru re:Imagine’s change in stimulus size as opposed to using a fixed size III stimulus was correlated for stimuli above 23 dB (r = 0.50, P < 0.001, 95% CI: 0.47–0.52) and below or equal to 23 dB (r = 0.67, P < 0.001, 95% CI: 0.63–0.70). As demonstrated in Figure 4, the agreement is good despite differences in testing strategies.
Regarding the feasibility of VF testing with the Magic Leap headset, 100% of consented participants were able to complete the re:Vive threshold test. Even the oldest patients enrolled (maximum age of 88 y) wore the headset while seated and used the wireless controller for the entire test. Barriers to the use of VR headsets have been described in other studies, such as the weight of the headset causing strain, as with the HMD VF perimeter described by Kimura et al8 in 2019, or headsets inducing claustrophobia in patients.31 In a separate study of 73 patients completing the Heru test, 88.5% preferred the headset to the HFA (Rajpal et al32 Poster presented at: ARVO annual meeting 2022 May 1–4, 2022; Denver, CO. Abstract no. 3712551.) In this study, we did not encounter barriers of weight and claustrophobia that prevented the successful completion of the test.
We demonstrate that the Heru re:Vive visual field is comparable to that of the HFA SITA Standard algorithm. The MS and MD are higher on average for the Heru VF tests. This is likely due to the difference in both the technology and algorithm used. In addition to the study limitations, patients’ initial unfamiliarity with the AR headset, as well as the overall subjective nature of visual field testing, point to the need for further research on the reliability of this device. Given the strength of the correlation, the device may be useful in clinical practice. Future studies should aim to assess the reproducibility of Heru re:Imagine, particularly among patients with glaucomatous disease, across the spectrum of severity, and to determine what association exists between the reported Heru reliability indices and its test-retest variability.
ACKNOWLEDGMENTS
The authors thank William Feuer, MS, and Dr. Elizabeth Vanner, PhD, of Bascom Palmer Eye Institute for their advice on statistical methods and analysis.
Supplementary Material
Footnotes
This study was supported by NIH Center Core Grant P30EY014801, and Research to Prevent Blindness-Unrestricted Grant to BPEI (GR004596).
United States Patents (Application No. 17/083,043 and 17/392,664). Patents are owned by the University of Miami and licensed to Heru, Inc.
Disclosure: M.A.S. is an equity holder, officer, and sits on the Board of Directors for Heru, Inc. M.D., A.N., V.L., M.C., C.A.D., R.K., and C.O.-B., are employed by or have been employed by Heru, Inc. The remaining authors declare no conflict of interest.
Supplemental Digital Content is available for this article. Direct URL citations are provided in the HTML and PDF versions of this article on the journal's website, www.glaucomajournal.com.
Contributor Information
Catherine Johnson, Email: cjj51@med.miami.edu.
Ahmed Sayed, Email: ahmed.hameed.sayed@gmail.com.
John McSoley, Email: jmcsoley@med.miami.edu.
Mary Durbin, Email: marykdurbin@yahoo.com.
Rashed Kashem, Email: Rkashem@heru.net.
Alexandra Nicklin, Email: alexandra.lescop@gmail.com.
Valeria Lopez, Email: vlopez@heru.net.
Georgeana Mijares, Email: gmijares@med.miami.edu.
Michael Chen, Email: mchen@heru.net.
Abdulla Shaheen, Email: Abdulla.shaheen.md@gmail.com.
Steven Segarra, Email: steven.segarra@temple.edu.
Nadine Rady, Email: nxr779@miami.edu.
Christian Andres Duque, Email: christian.duque@med.miami.edu.
Collins Opoku-Baah, Email: copokubaah@gmail.com.
Mohamed Abou Shousha, Email: mshousha@med.miami.edu.
REFERENCES
- 1.Bengtsson B, Olsson J, Heijl A, et al. A new generation of algorithms for computerized threshold perimetry, SITA. Acta Ophthalmol Scand. 1997;75:368–375. [DOI] [PubMed] [Google Scholar]
- 2.Budenz DL, Rhee P, Feuer WJ, et al. Sensitivity and specificity of the Swedish interactive threshold algorithm for glaucomatous visual field defects. Ophthalmology. 2002;109:1052–1058. [DOI] [PubMed] [Google Scholar]
- 3.Wild JM, Pacey IE, O’Neill EC, et al. The SITA perimetric threshold algorithms in glaucoma. Invest Ophthalmol Vis Sci. 1999;40:1998–2009. [PubMed] [Google Scholar]
- 4.Alawa KA, Nolan RP, Han E, et al. Low-cost, smartphone-based frequency doubling technology visual field testing using a head-mounted display. Br J Ophthalmol. 2021;105:440–444. [DOI] [PubMed] [Google Scholar]
- 5.Kong YXG, He M, Crowston JG, et al. A comparison of perimetric results from a tablet perimeter and Humphrey field analyzer in glaucoma patients. Transl Vis Sci Technol. 2016;5:2. [DOI] [PMC free article] [PubMed] [Google Scholar]
- 6.Jones PR. An open-source static threshold perimetry test using remote eye-tracking (Eyecatcher): description, validation, and preliminary normative data. Transl Vis Sci Technol. 2020;9:18. [DOI] [PMC free article] [PubMed] [Google Scholar]
- 7.Jones L, Callaghan T, Campbell P, et al. Acceptability of a home-based visual field test (Eyecatcher) for glaucoma home monitoring: a qualitative study of patients’ views and experiences. BMJ Open. 2021;11:e043130. [DOI] [PMC free article] [PubMed] [Google Scholar]
- 8.Kimura T, Matsumoto C, Nomoto H. Comparison of head-mounted perimeter (imo®) and Humphrey field analyzer. Clin Ophthalmol. 2019;13:501–513. [DOI] [PMC free article] [PubMed] [Google Scholar]
- 9.Montelongo M, Gonzalez A, Morgenstern F, et al. A virtual reality-based automated perimeter, device, and pilot study. Transl Vis Sci Technol. 2021;10:20. [DOI] [PMC free article] [PubMed] [Google Scholar]
- 10.Razeghinejad R, Gonzalez-Garcia A, Myers JS, et al. Preliminary report on a novel virtual reality perimeter compared with standard automated perimetry. J Glaucoma. 2021;30:17–23. [DOI] [PubMed] [Google Scholar]
- 11.Stapelfeldt J, Kucur SS, Huber N, et al. Virtual reality-based and conventional visual field examination comparison in healthy and glaucoma patients. Transl Vis Sci Technol. 2021;10:10. [DOI] [PMC free article] [PubMed] [Google Scholar]
- 12.Mees L, Upadhyaya S, Kumar P, et al. Validation of a head mounted virtual reality visual field screening device. J Glaucoma. 2020;29:86–91. [DOI] [PubMed] [Google Scholar]
- 13.Hodapp E, Parrish RK, Anderson DR. Clinical Decisions in Glaucoma. St. Louis: Mosby-Year Book; 1993. [Google Scholar]
- 14.Barlow HB. Temporal and spatial summation in human vision at different background intensities. J Physiol. 1958;141:337–350. [DOI] [PMC free article] [PubMed] [Google Scholar]
- 15.Wilson ME. Invariant features of spatial summation with changing locus in the visual field. J Physiol. 1970;207:611–622. [DOI] [PMC free article] [PubMed] [Google Scholar]
- 16.Wilson ME. Spatial and temporal summation in impaired regions of the visual field. J Physiol. 1967;189:189–208. [DOI] [PMC free article] [PubMed] [Google Scholar]
- 17.Wall M, Woodward KR, Doyle CK, et al. Repeatability of automated perimetry: a comparison between standard automated perimetry with stimulus size III and V, matrix, and motion perimetry. 1st edition. Invest Ophthalmol Vis Sci. 2009;50:974–979. [DOI] [PubMed] [Google Scholar]
- 18.Heijl A. The Humphrey field analyzer, construction and concepts. Doc Ophthalmol Proc Ser. 1985;42:77–84. [Google Scholar]
- 19.Cohen J, Cohen P, West SG, et al. Applied Multiple Regression/Correlation Analysis for the Behavioral Sciences, 3rd edn. Routledge; 2013. [Google Scholar]
- 20.Koo TK, Li MY. A guideline of selecting and reporting intraclass correlation coefficients for reliability research. J Chiropr Med. 2016;15:155–163. [DOI] [PMC free article] [PubMed] [Google Scholar]
- 21.Artes P, Iwase A, Ohno Y, et al. Properties of perimetric threshold estimates from Full Threshold, SITA Standard, and SITA Fast strategies. Invest Ophthalmol Vis Sci. 2002;43:2654–2659. [PubMed] [Google Scholar]
- 22.Russell RA, Crabb DP, Malik R, et al. The relationship between variability and sensitivity in large-scale longitudinal visual field data. Invest Ophthalmol Vis Sci. 2012;53:5985–5990. [DOI] [PubMed] [Google Scholar]
- 23.Goukon H, Hirasawa K, Kasahara M, et al. Comparison of Humphrey field analyzer and imo visual field test results in patients with glaucoma and pseudofixation loss. PLoS One. 2019;14:e0224711. [DOI] [PMC free article] [PubMed] [Google Scholar]
- 24.Yohannan J, Wang J, Brown J, et al. Evidence-based criteria for assessment of visual field reliability. Ophthalmology. 2017;124:1612–1620. [DOI] [PMC free article] [PubMed] [Google Scholar]
- 25.Ishiyama Y, Murata H, Mayama C, et al. An objective evaluation of gaze tracking in Humphrey perimetry and the relation with the reproducibility of visual fields: a pilot study in glaucoma. Invest Ophthalmol Vis Sci. 2014;55:8149–8152. [DOI] [PubMed] [Google Scholar]
- 26.Aboobakar IF, Wang J, Chauhan BC, et al. Factors Predicting a greater likelihood of poor visual field reliability in glaucoma patients and suspects. Transl Vis Sci Technol. 2020;9:4. [DOI] [PMC free article] [PubMed] [Google Scholar]
- 27.Bengtsson B. Reliability of computerized perimetric threshold tests as assessed by reliability indices and threshold reproducibility in patients with suspect and manifest glaucoma. Acta Ophthalmol Scand. 2000;78:519–522. [DOI] [PubMed] [Google Scholar]
- 28.Kelly SR, Bryan SR, Crabb DP. Does eye examination order for standard automated perimetry matter? Acta Ophthalmol. 2019;97:e833–e838. [DOI] [PMC free article] [PubMed] [Google Scholar]
- 29.Heijl A, Bengtsson B. The effect of perimetric experience in patients with glaucoma. Arch Ophthalmol. 1996;114:19–22. [DOI] [PubMed] [Google Scholar]
- 30.Narang P, Agarwal A, Srinivasan M, et al. Advanced vision analyzer-virtual reality perimeter: device validation, functional correlation and comparison with Humphrey field analyzer. Ophthalmol Sci. 2021;1:100035. [DOI] [PMC free article] [PubMed] [Google Scholar]
- 31.Tsai CF, Yeh SC, Huang Y, et al. The effect of augmented reality and virtual reality on inducing anxiety for exposure therapy: a comparison using heart rate variability. J Healthc Eng. 2018;2018:1–8. [DOI] [PMC free article] [PubMed] [Google Scholar]
- 32.Sachin Rajpal, Mary Durbin, Alexandra Nicklin, et al. Evaluation of Patient Acceptance for Visual Field Testing with a Wearable Device. Invest Ophthalmol Vis Sci. 2022;63:1270–A0410. [Google Scholar]