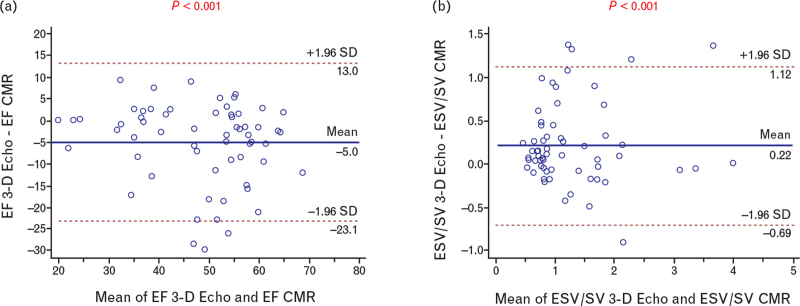
Fig. 4.
(a) Bland and Altman plot of differences between 3-D Echo and CMR vs. the mean of the two measurements for EF. Representation of limits of agreement (dotted lines) from −1.96 standard deviation to +1.96 standard deviation. (b) Bland and Altman plot of differences between 3-D Echo and CMR vs. the mean of the two measurements for ESV/SV. Representation of limits of agreement (dotted lines) from −1.96 standard deviation to +1.96 standard deviation. 3-D, three-dimensional; CMR, cardiovascular magnetic resonance; EF, ejection fraction; ESV, end-systolic volume.

