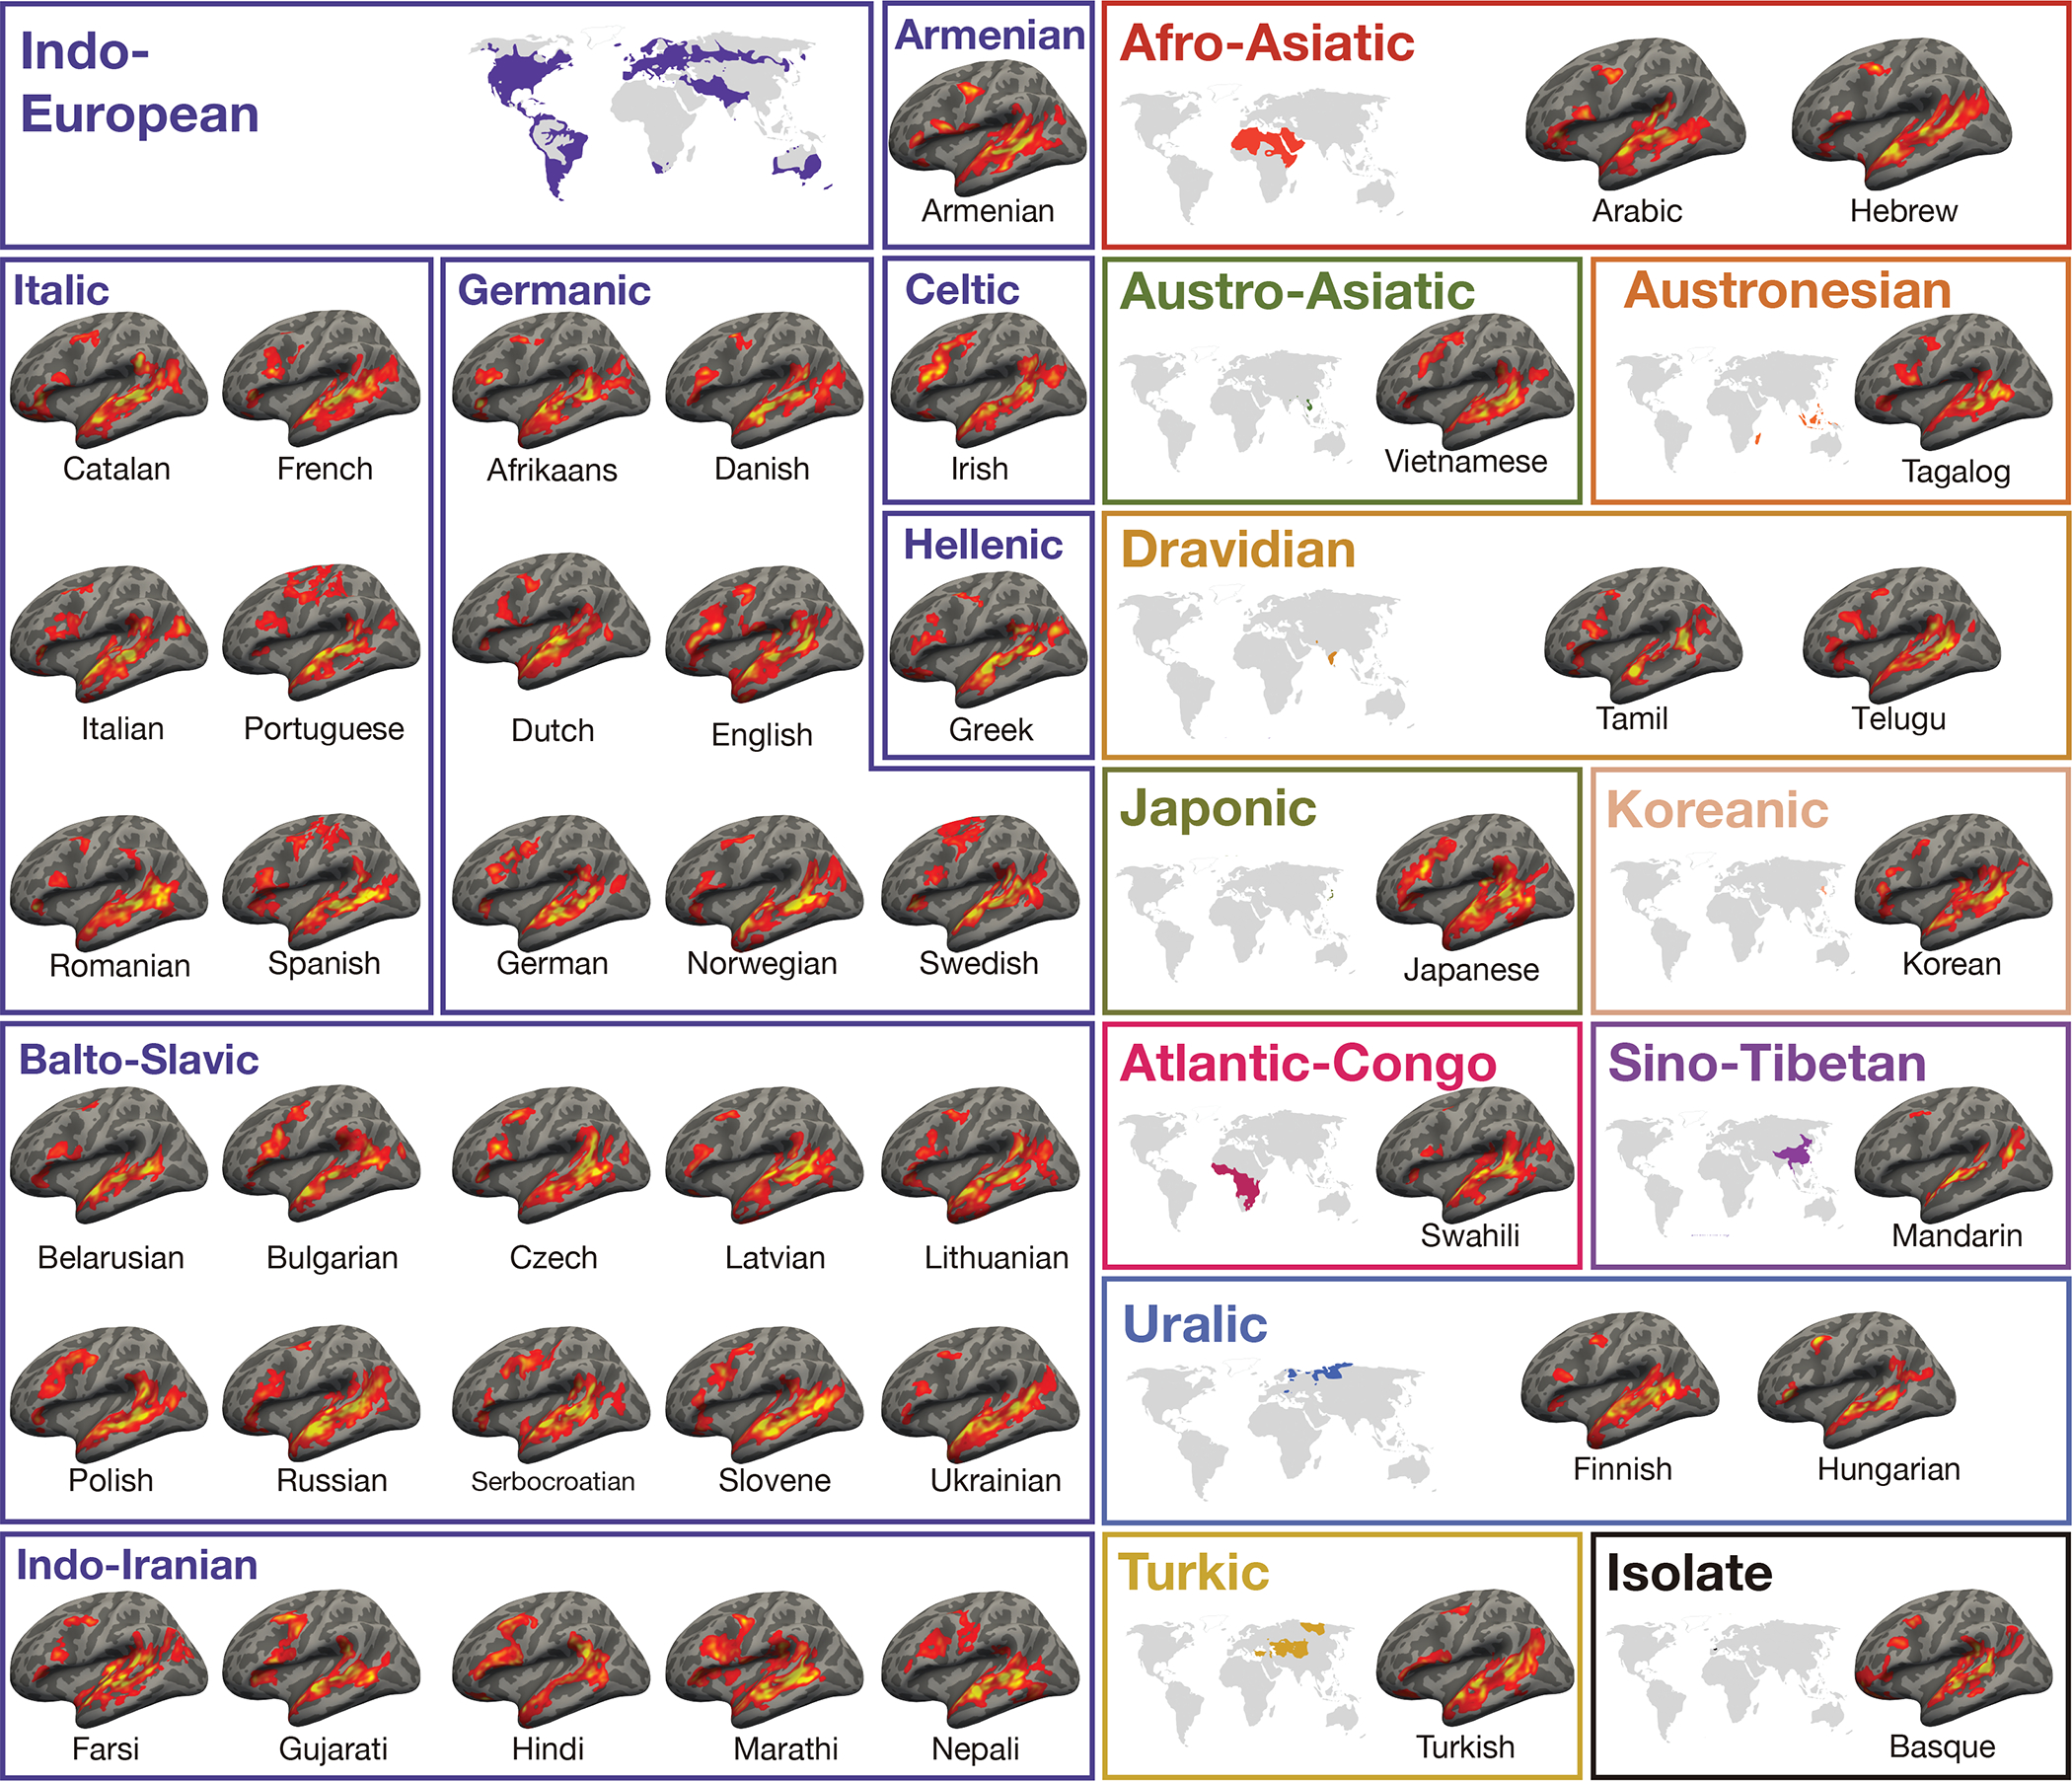
Figure 1.

Activation maps for the Alice language localizer contrast (Native-language>Degraded-language) in the left hemisphere (LH) of a sample participant for each language (see Extended Data Figure 2 for RH maps and details of the image generation procedure). The general topography of the language network in speakers of 45 languages is similar, and the variability observed is comparable to the variability that has been reported for the speakers of the same language10 (Extended Data Figure 8). A significance map was generated for each participant by FreeSurfer; each map was smoothed using a Gaussian kernel of 4 mm full-width half-max and thresholded at the 70th percentile of the positive contrast for each participant. The surface overlays were rendered on the 80% inflated white-gray matter boundary of the fsaverage template using FreeView/FreeSurfer. Opaque red and yellow correspond to the 80th and 99th percentile of positive-contrast activation for each subject, respectively. (These maps were used solely for visualization; all the analyses were performed on the data analyzed in the volume (see Extended Data Figure 3).)
