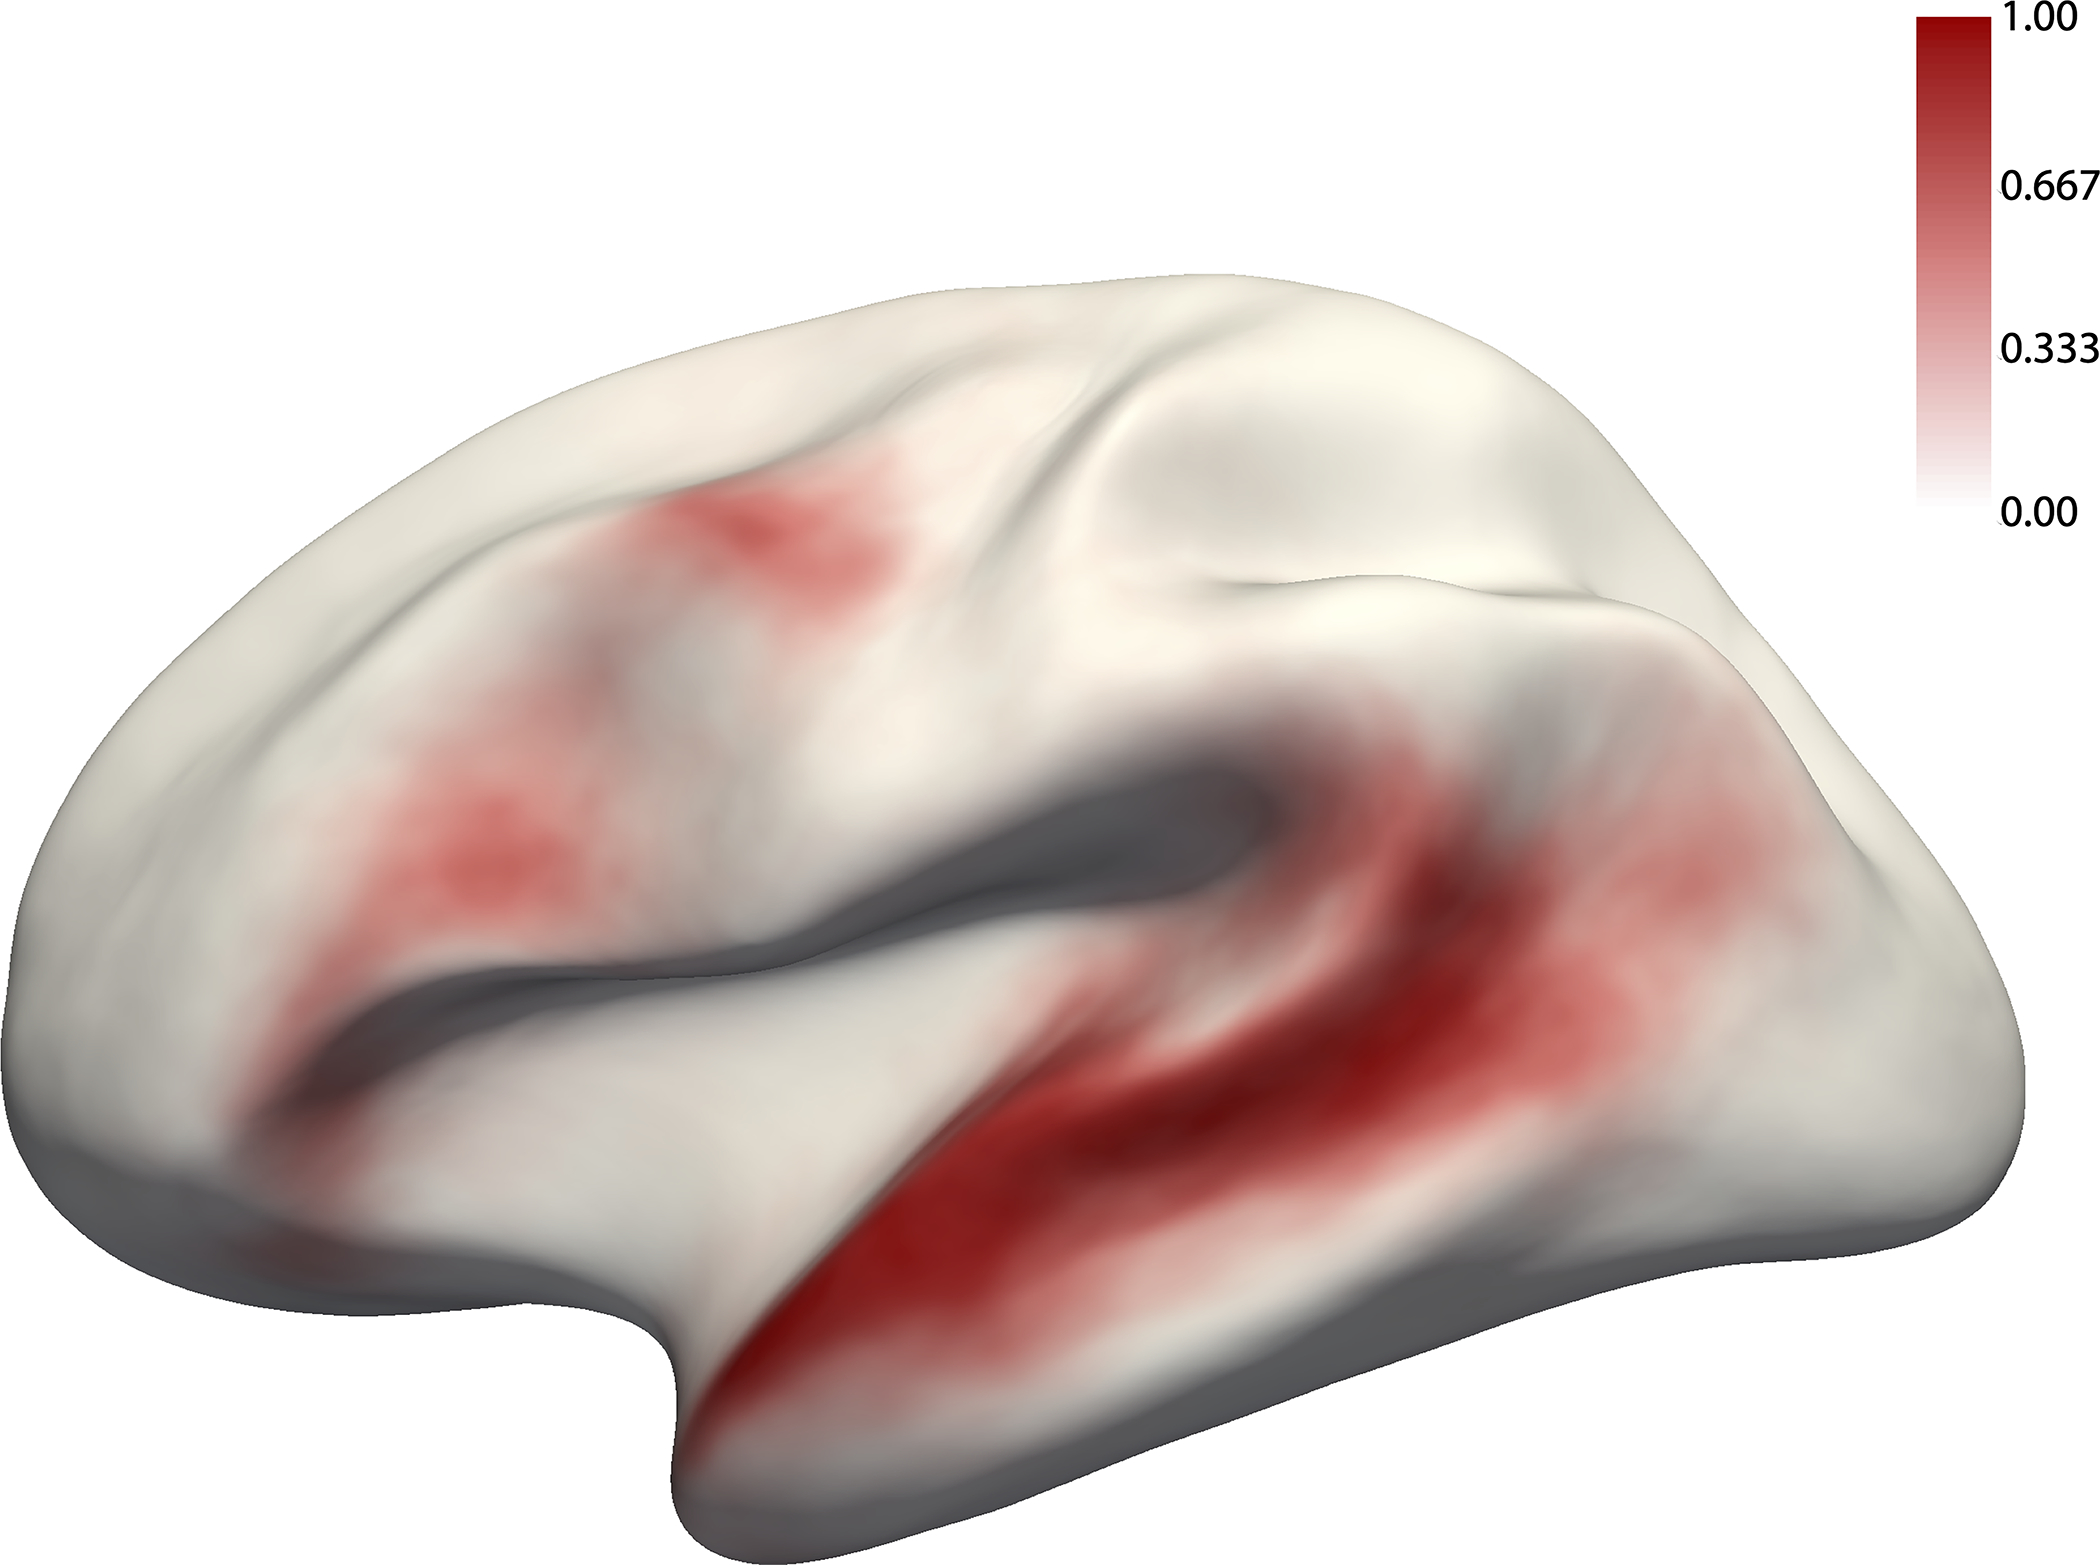
Figure 2.

The probabilistic overlap map for the Native-language>Degraded-language contrast. This map was created by binarizing and overlaying the 86 participants’ individual maps (like those shown in Figure 1). The value in each vertex corresponds to the proportion of participants for whom that vertex belongs to the language network (see Extended Data Figure 8 for a comparison between this probabilistic atlas vs. atlases based on native speakers of the same language).
