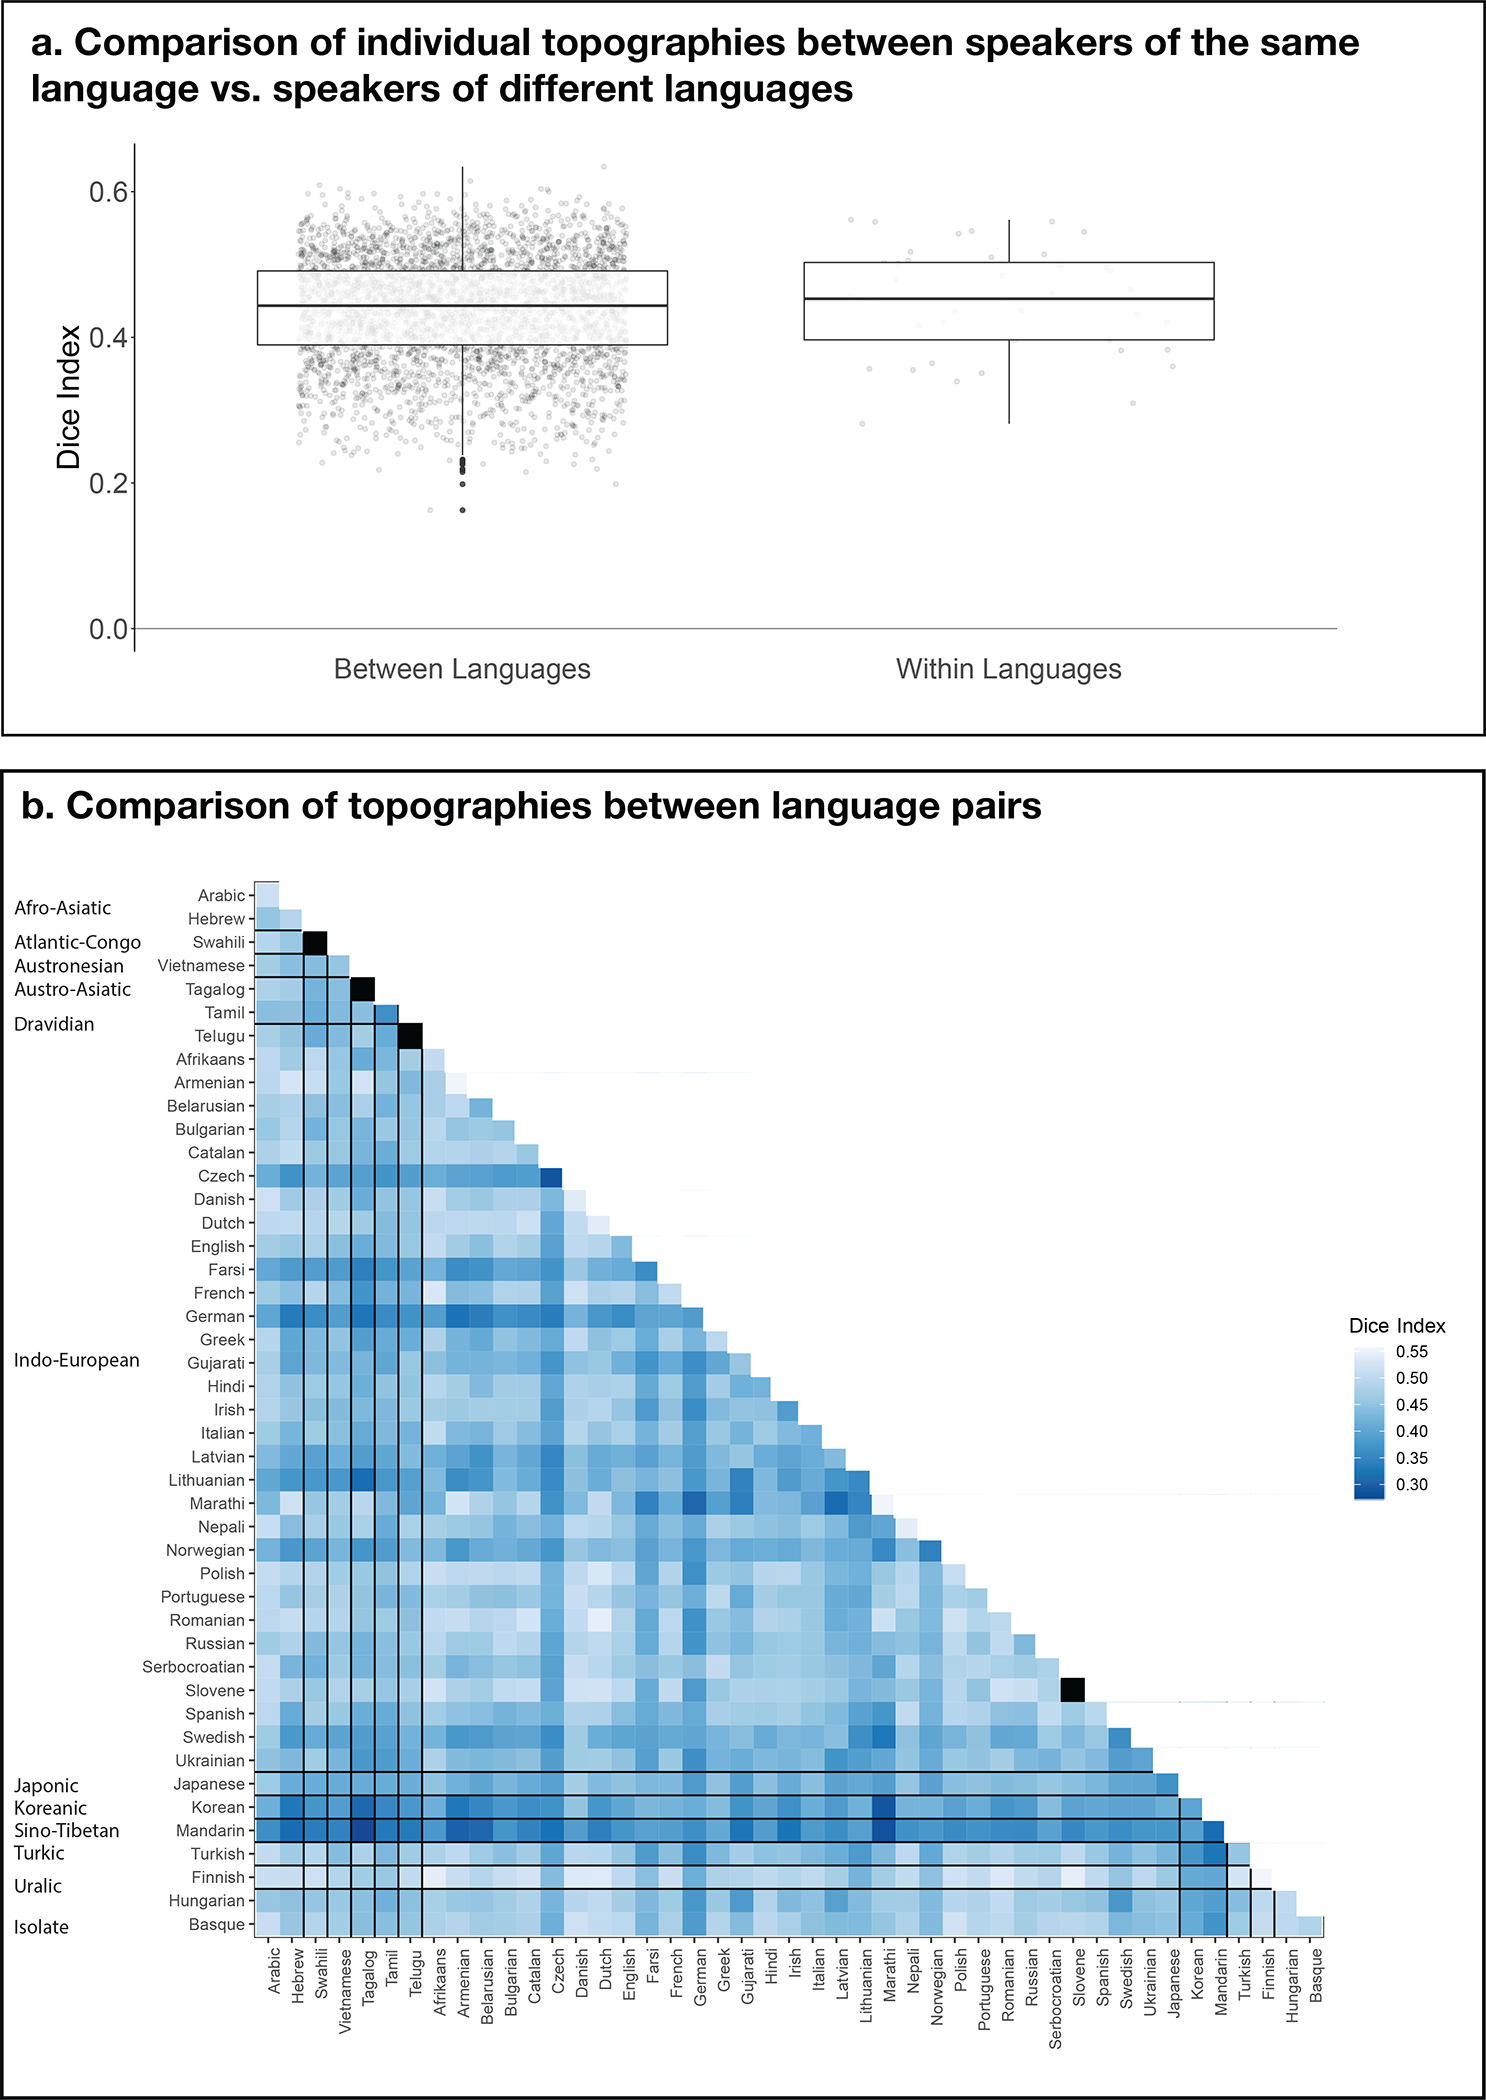
Extended Data Fig. 6.

A comparison of individual LH topographies between speakers of the same language vs. between speakers of different languages. The goal of this analysis was to test whether inter-language / inter-language-family similarities might be reflected in the similarity structure of the activation patterns. To perform this analysis, we computed a Dice coefficient57 for each pair of individual activation maps for the Intact-language>Degraded-language contrast (a total of n=3,655 pairs across the 86 participants). To do so, we used the binarized maps like those shown in Extended Data Figure 3a, where in each LH language parcel the top 10% of most responsive voxels were selected. Then, for each pair of images, we divided the number of overlapping voxels multiplied by 2 by the sum of the voxels across the two images (this value was always the same and equaling 1,358 given that each map had the same number of selected voxels). The resulting values can vary from 0 (no overlapping voxels) to 1 (all voxels overlap). a) A comparison of Dice coefficients for pairs of maps between languages (left, n=3,655 pairs) vs. within languages (right; this could be done for 41/45 languages for which two speakers were tested). If the activation landscapes are more similar within than between languages, then the Dice coefficients for the within-language comparisons should be higher. Instead, no reliable difference was observed by an independent-samples t-test (average within-language: 0.17 (SD=0.07), average between-language: 0.16 (SD=0.06); t(40.7)=−0.52, p= 0.61; see also Extended Data Figure 8 for evidence that the range of overlap values in probabilistic atlases created from speakers of diverse languages vs. speakers of the same language are comparable). Box plots include the first quartile (lower hinge), third quartile (upper hinge), and median (central line); upper and lower whiskers extend from the hinges to the largest value no further than 1.5 times the inter-quartile range; darker-colored dots correspond to outlier data points. b) Dice coefficient values for all pairs of within- and between-language comparisons (the squares in black on the diagonal correspond to languages with only one speaker tested). As can be seen in the figure and in line with the results in panel a, no structure is discernible that would suggest greater within-language / within-language-family topographic similarity. Similar to the results from the within- vs. between-language comparison in a, the within-language-family vs. between-language-family comparison did not reveal a difference (t(19.8)=0.71, p=0.49). In summary, in the current dataset (collected with the shallow sampling approach, i.e., a small number of speakers from a larger number of languages), no clear similarity structure is apparent that would suggest more similar topographies among speakers of the same language, or among speakers of languages that belong to the same language family.
