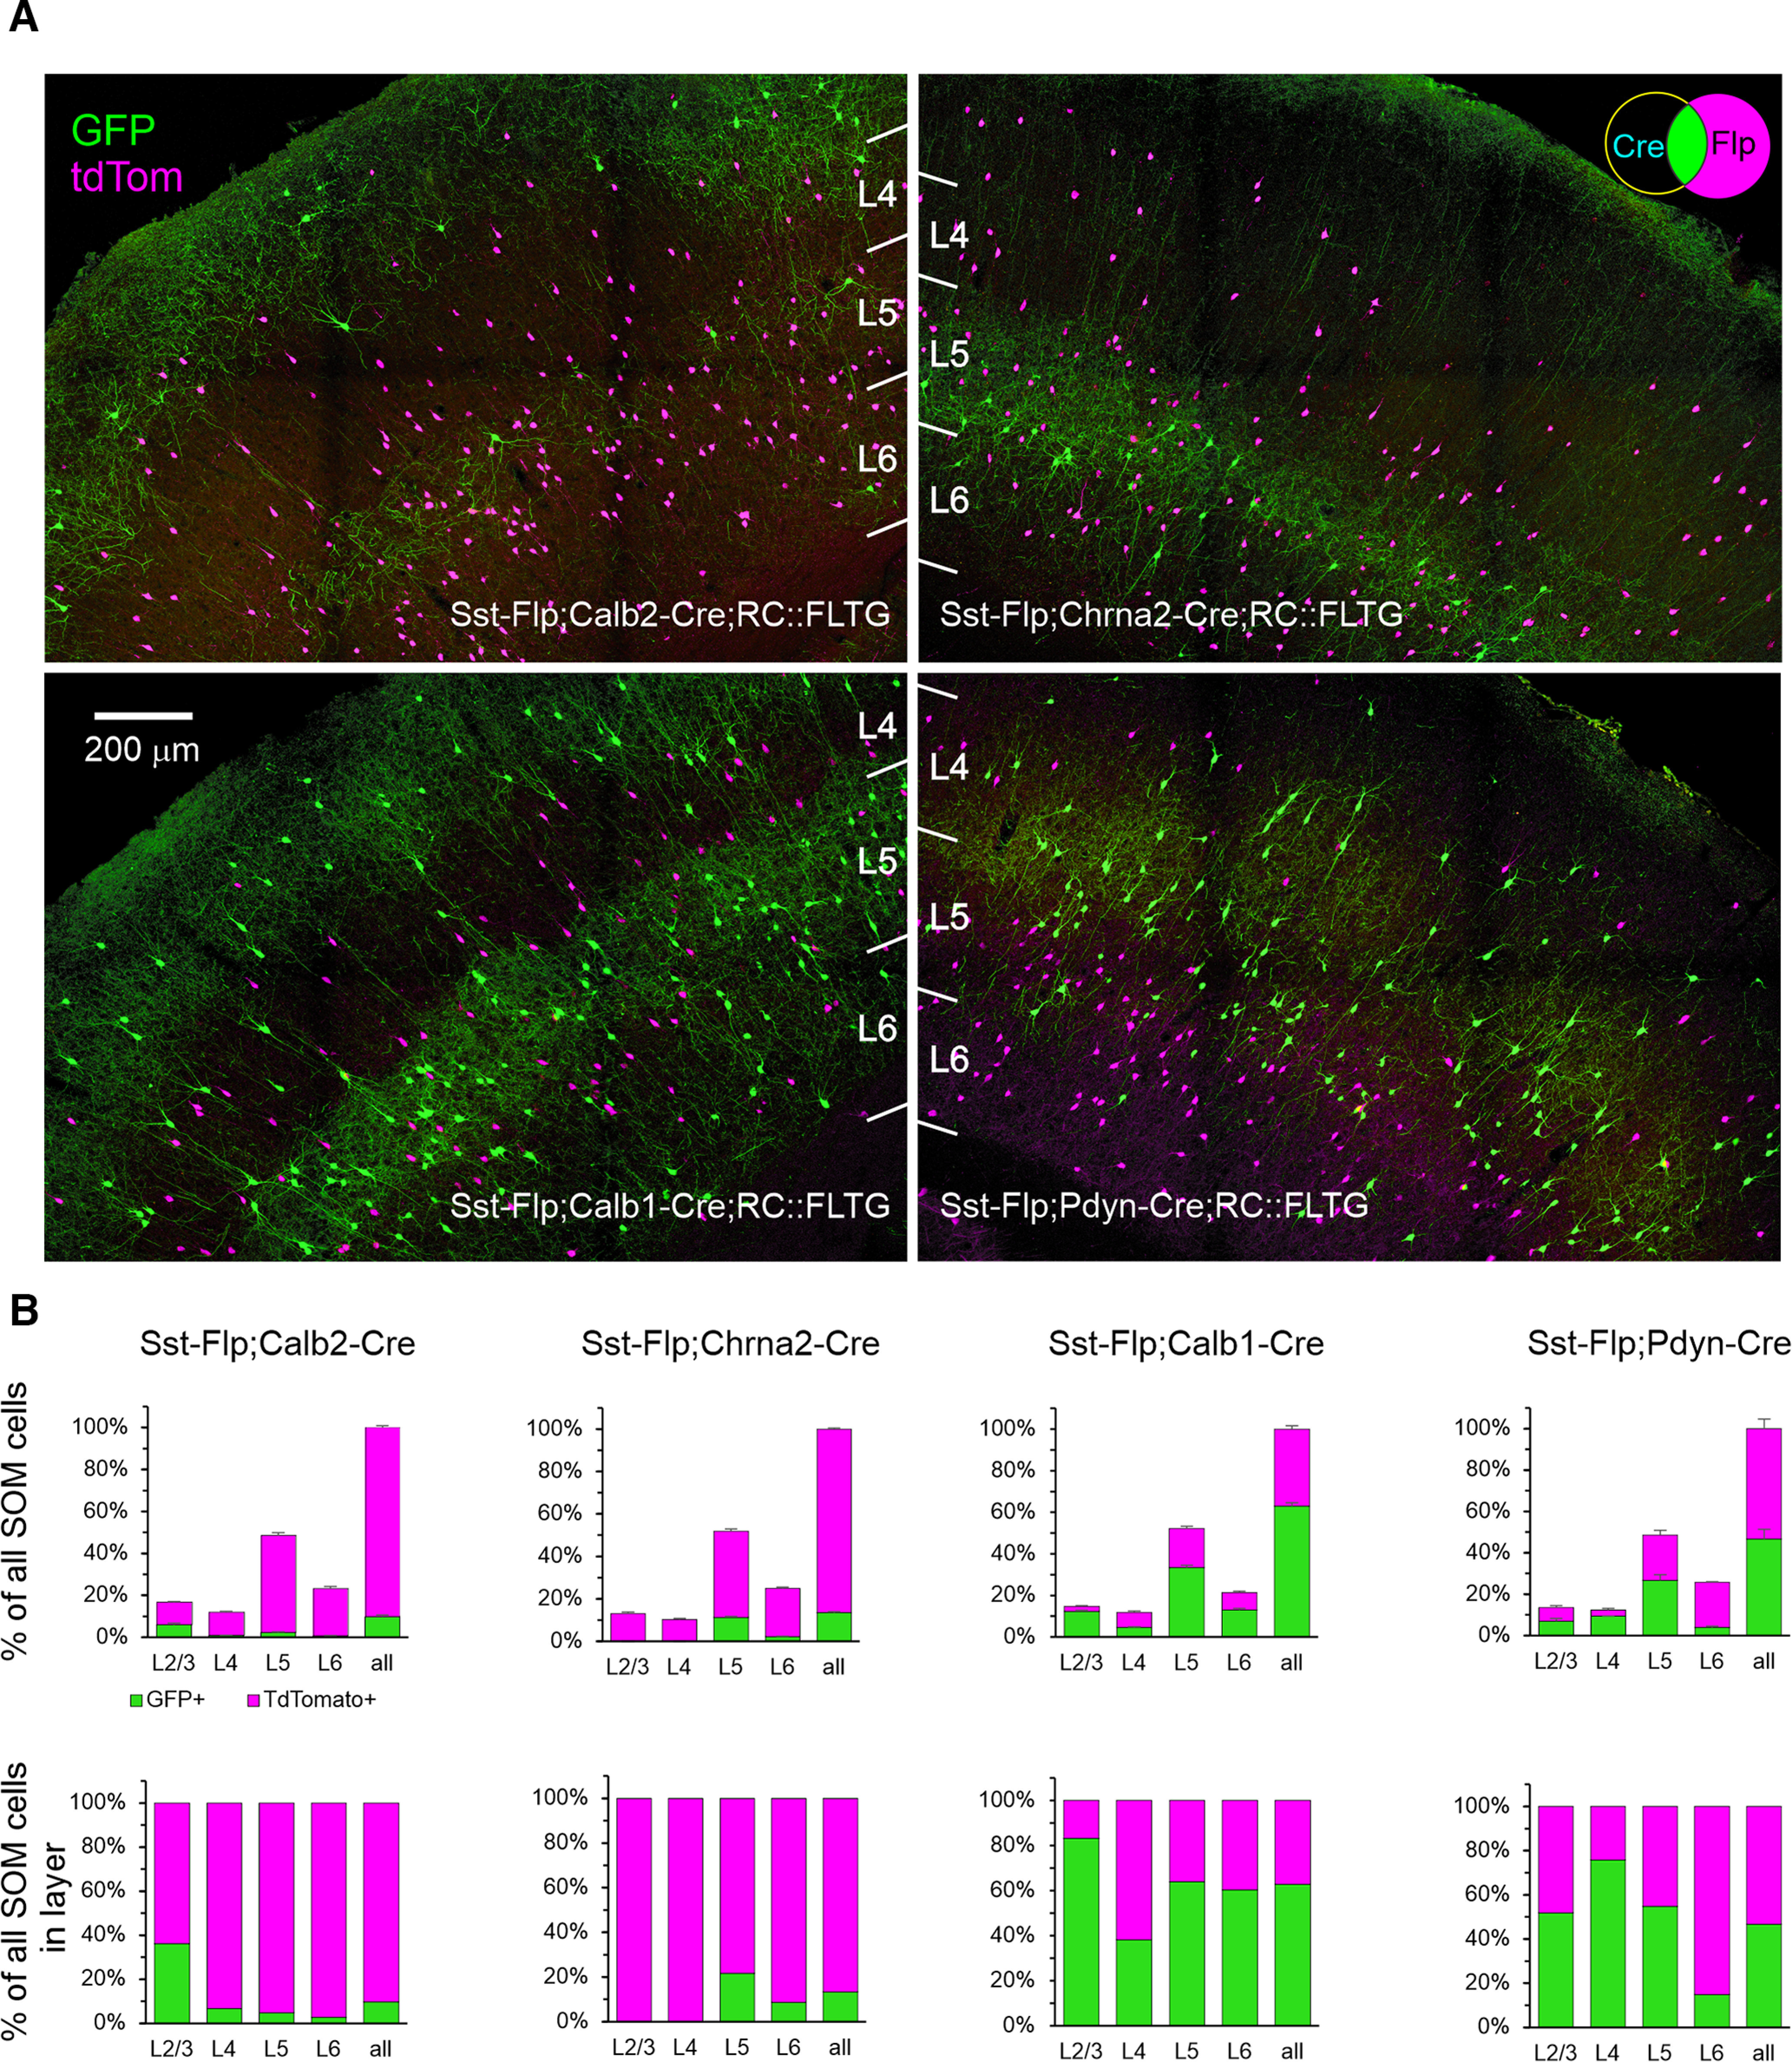
Figure 1.

Fluorescent reporter expression in the 4 intersectional genotypes. A, Representative projections of confocal z-stacks taken with a 20×, 0.75 NA objective at 2.5 μ;m z-steps through 30-μ;m-thick sections. Color channels were adjusted individually in each panel. The Venn diagram in top right illustrates the combinatorial logic of the reporter. B, Top panels, TdTomato+ and GFP+ fraction of all SOM cells counted in each brain, averaged by genotype. Error bars are the SEM. Bottom panels, The same data normalized by layer. N = 4, 6, 4, and 3 mice for Calb2, Chrna2, Calb1, and Pdyn intersections, respectively. Numerical data are provided in Table 1.
