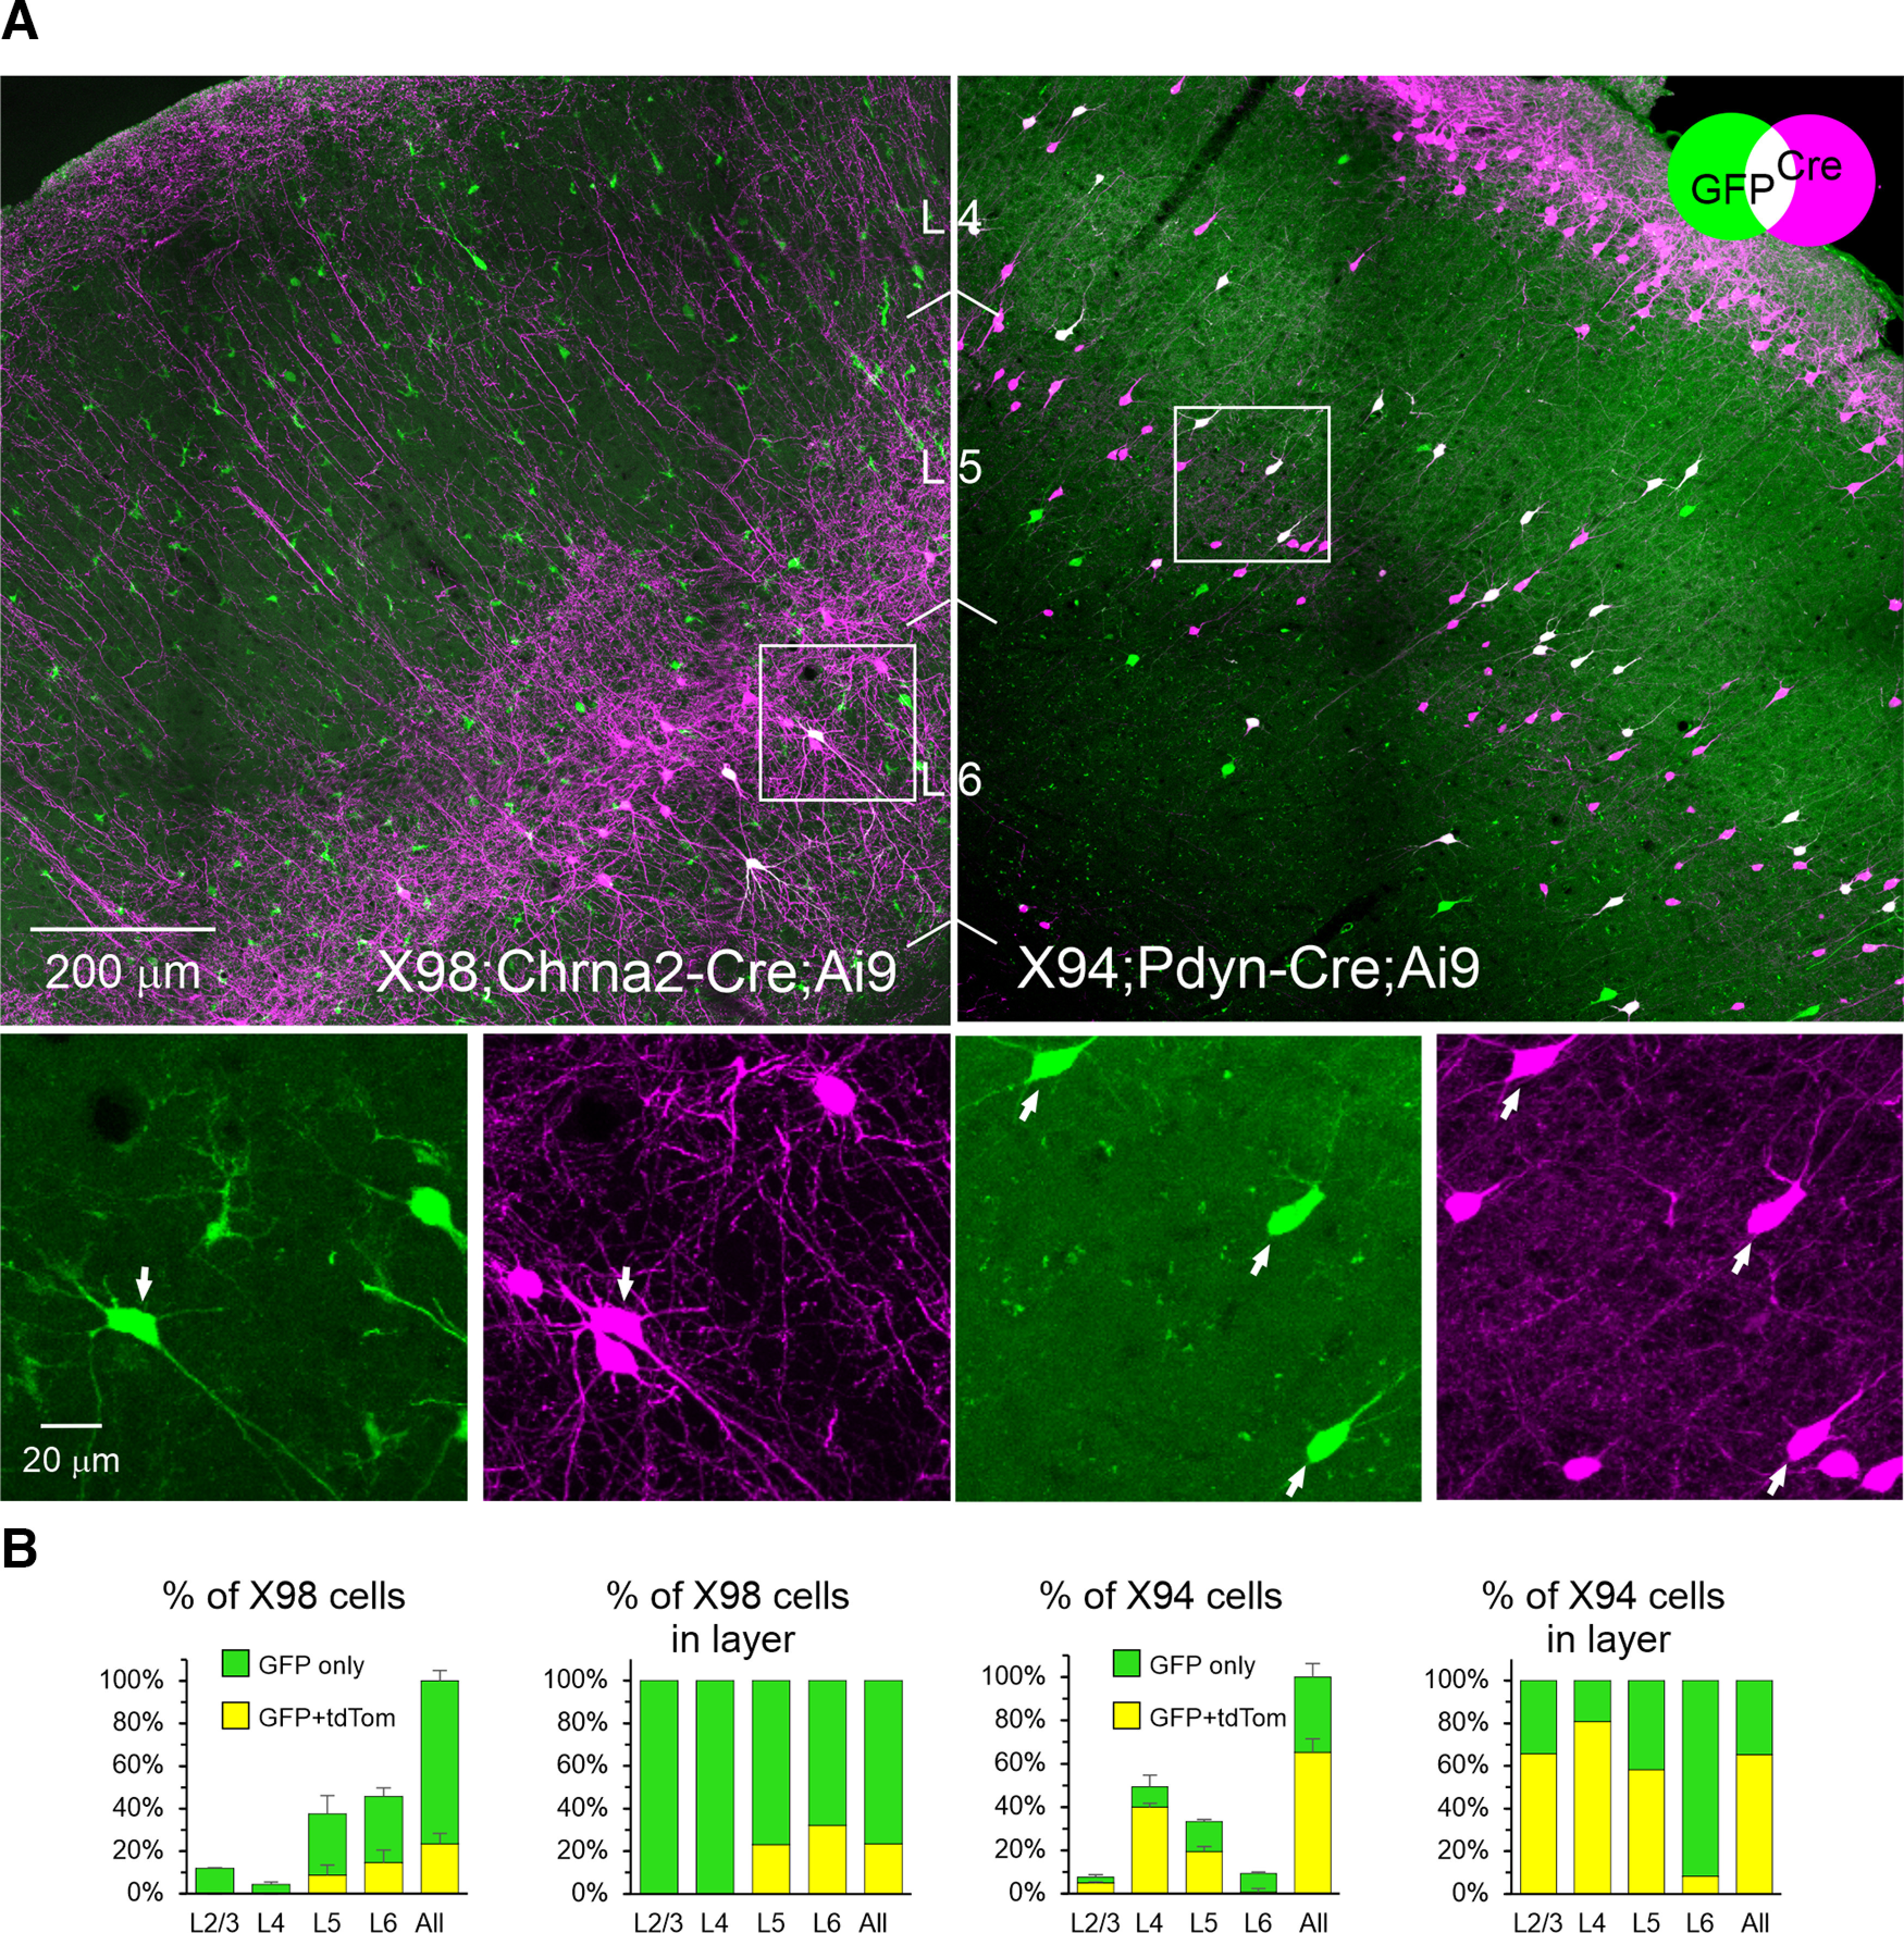
Figure 2.

Overlap of intersectional and transgenic subsets. X98 mice were crossed with Chrna2-Cre and a tdTomato reporter, and X94 mice were crossed with Pdyn-Cre and a tdTomato reporter. A, Projections of confocal z-stacks through representative 30-μ;m-thick sections of the indicated genotype, taken with a 20×, 0.75 NA objective at 2.5 μ;m z-steps. The Venn diagram illustrates the combinatorial color code. Color channels were adjusted individually in each panel. Boxed ROIs in top panels are shown at higher magnification in bottom panels, separated into the two color channels. Arrows point to double-labeled cells. In the top left panel, note a large number of non-SOM cells, many with glial morphology, weakly expressing GFP. In the top right panel, note that a considerable population of L2 pyramidal neurons also expressed Pdyn-Cre, underscoring the need for the intersectional approach used here. B, Left panel of each genotype shows the fraction of GFP+-only and double-labeled cells (GFP+/tdTomato+) in each layer, of all GFP+ cells counted in each brain, averaged by genotype. Error bars are the SEM. The right panel of each genotype block shows the same counts expressed as a fraction of all GFP+ cells in each layer. N = 3, 2, for X98 and X94, respectively. Numerical data are provided in Table 2.
