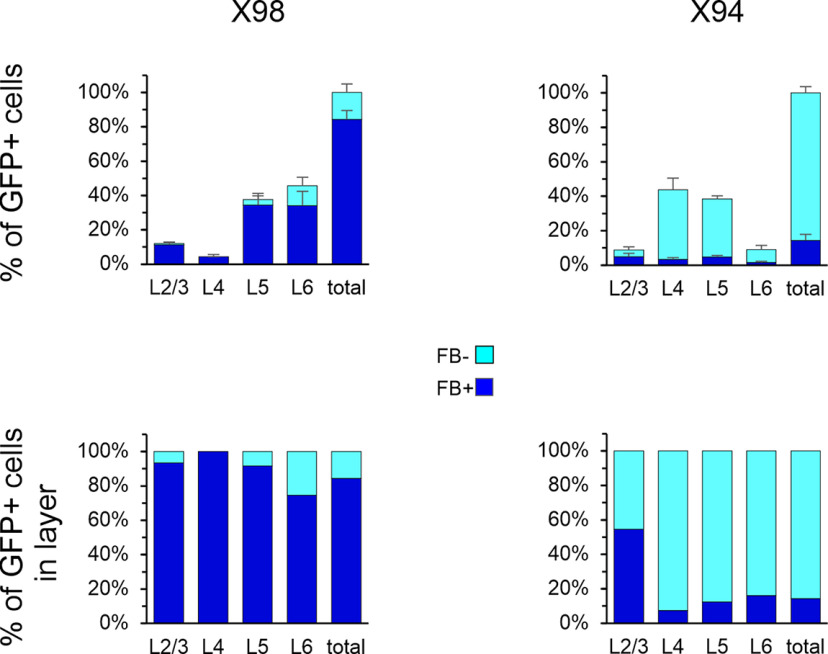
Figure 3.
Retrograde FB labeling in the X98 and X94 subtypes. Top panels, Number of FB+ and FB– GFP+ cells, as a fraction of all GFP+ cells counted in each brain, averaged by genotype. Bottom panels, Same numbers as a fraction of all GFP+ cells in each layer. Numerical data are provided in Table 3.

