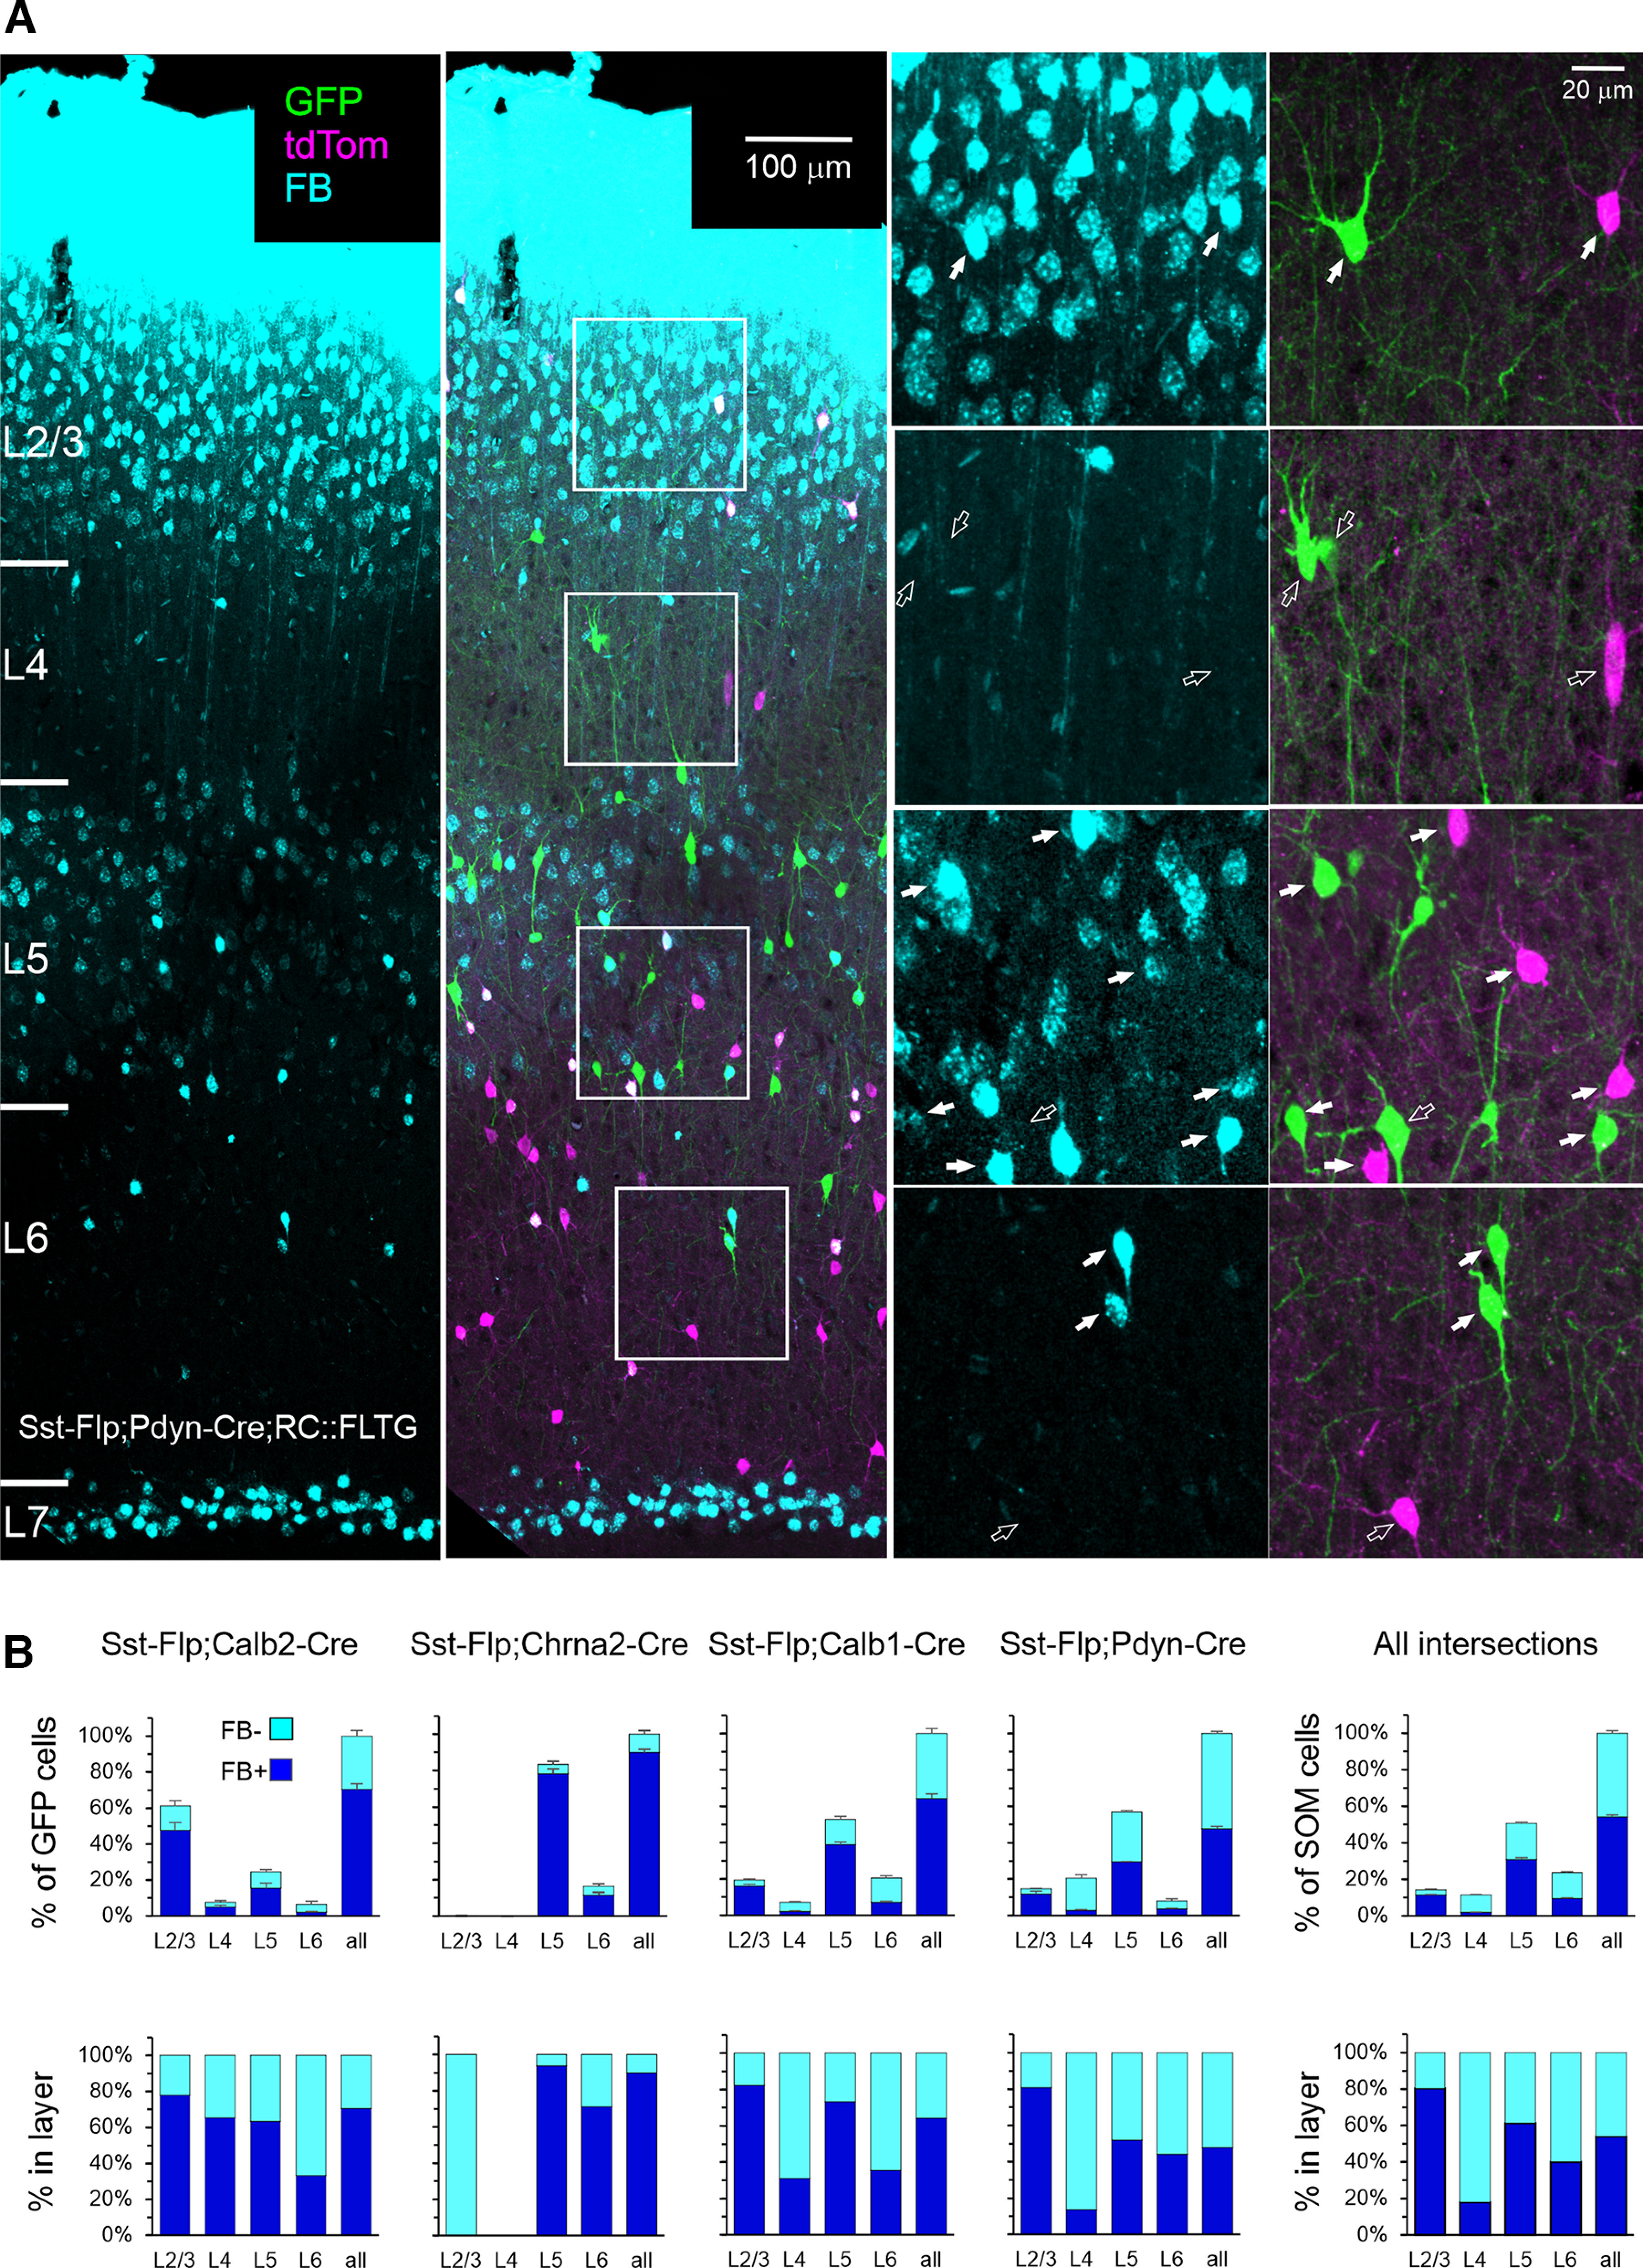
Figure 4.

Retrograde FB labeling. A, Representative 30-μ;m-thick section from a retrogradely labeled Pdyn mouse. Image is a projection of a z-stack taken with a 20×, 0.75 NA objective at 2.5 μ;m z-steps; color channels were adjusted individually in each panel. Far left panel shows only the FB color channel, and the adjacent panel also shows GFP and tdTomato channels. The 4 boxed ROIs are shown enlarged to the right, separated into the FB channel (left panels) and GFP-tdTomato channels (right panels). Filled arrows point to all FB+ SOM cells in each ROI, hollow arrows point to all FB– SOM cells. B, Top panels, Number of FB+ and FB– GFP+ cells as a percentage of all GFP+ cells counted in each brain, averaged by genotype. Bottom panels, Same numbers as a percentage of all GFP+ cells in each layer. Error bars are the SEM. Plots at the far right show the fraction of FB+ cells of all SOM cells in all genotypes. The number of animals is as in Figure 1. Numerical data are provided in Table 4.
