Figure 5.
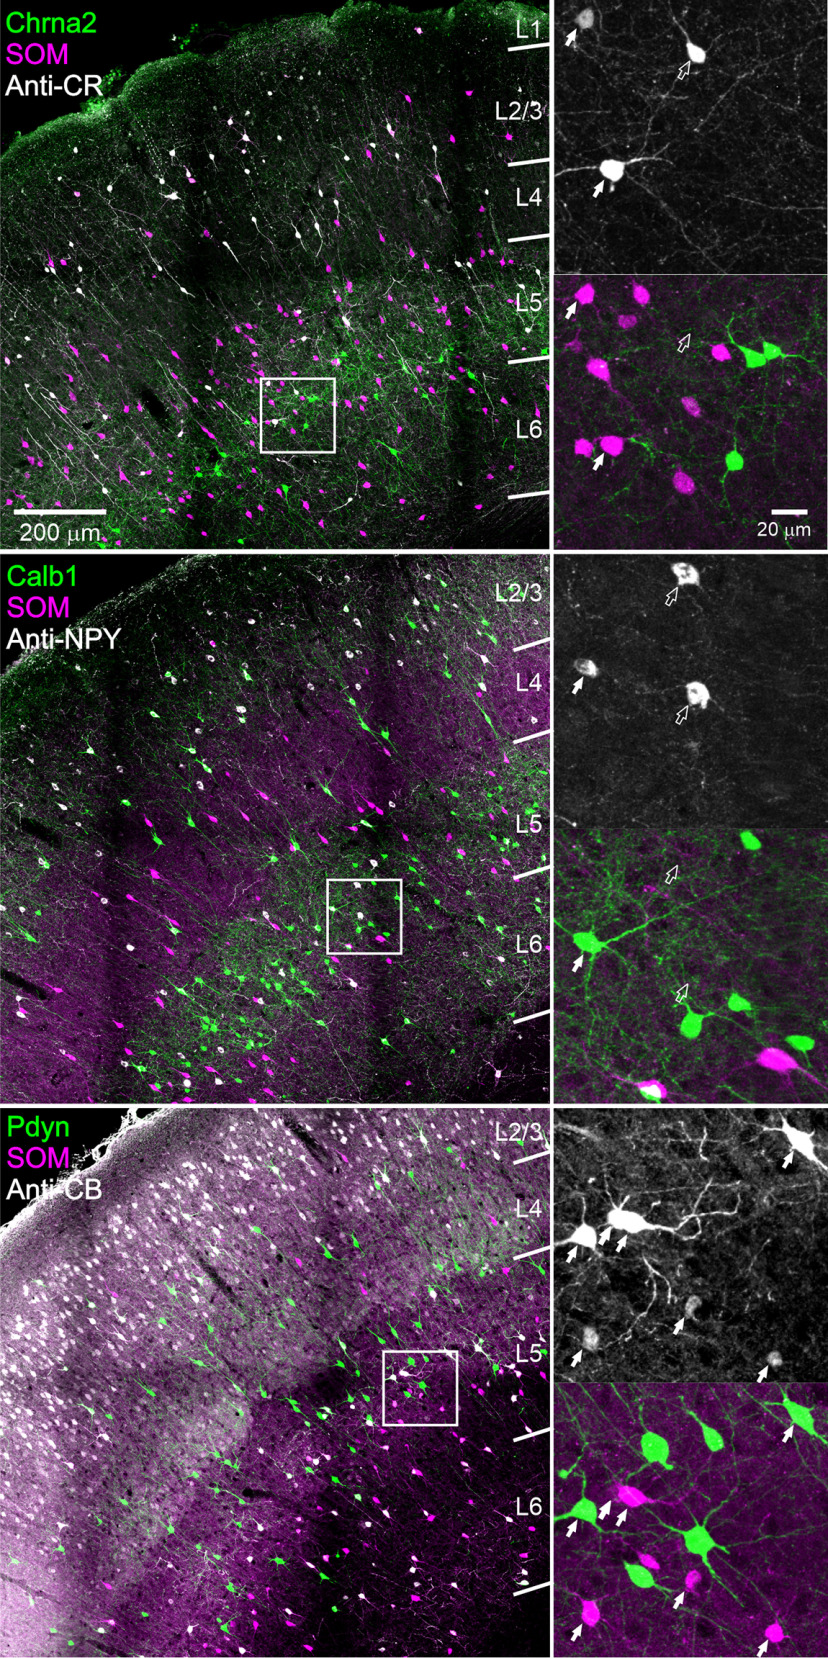
Immunostaining against 3 marker proteins. Top panels, Anti-CR immunostaining on a representative Chrna2 section. Middle panels, Anti-NPY immunostaining on a representative Calb1 section. Bottom panels, Anti-CB immunostaining on a representative Pdyn section. All images are projections of z-stacks taken with a 20×, 0.75 NA objective at 2.5 μ;m z-steps. Color channels were adjusted individually in each panel. For each section, one ROI is shown enlarged on the right, separated into two panels by color channels. Filled arrows indicate immunopositive SOM cells (GFP+ or tdTomato+), and hollow arrows indicate immunopositive non-SOM cells.

