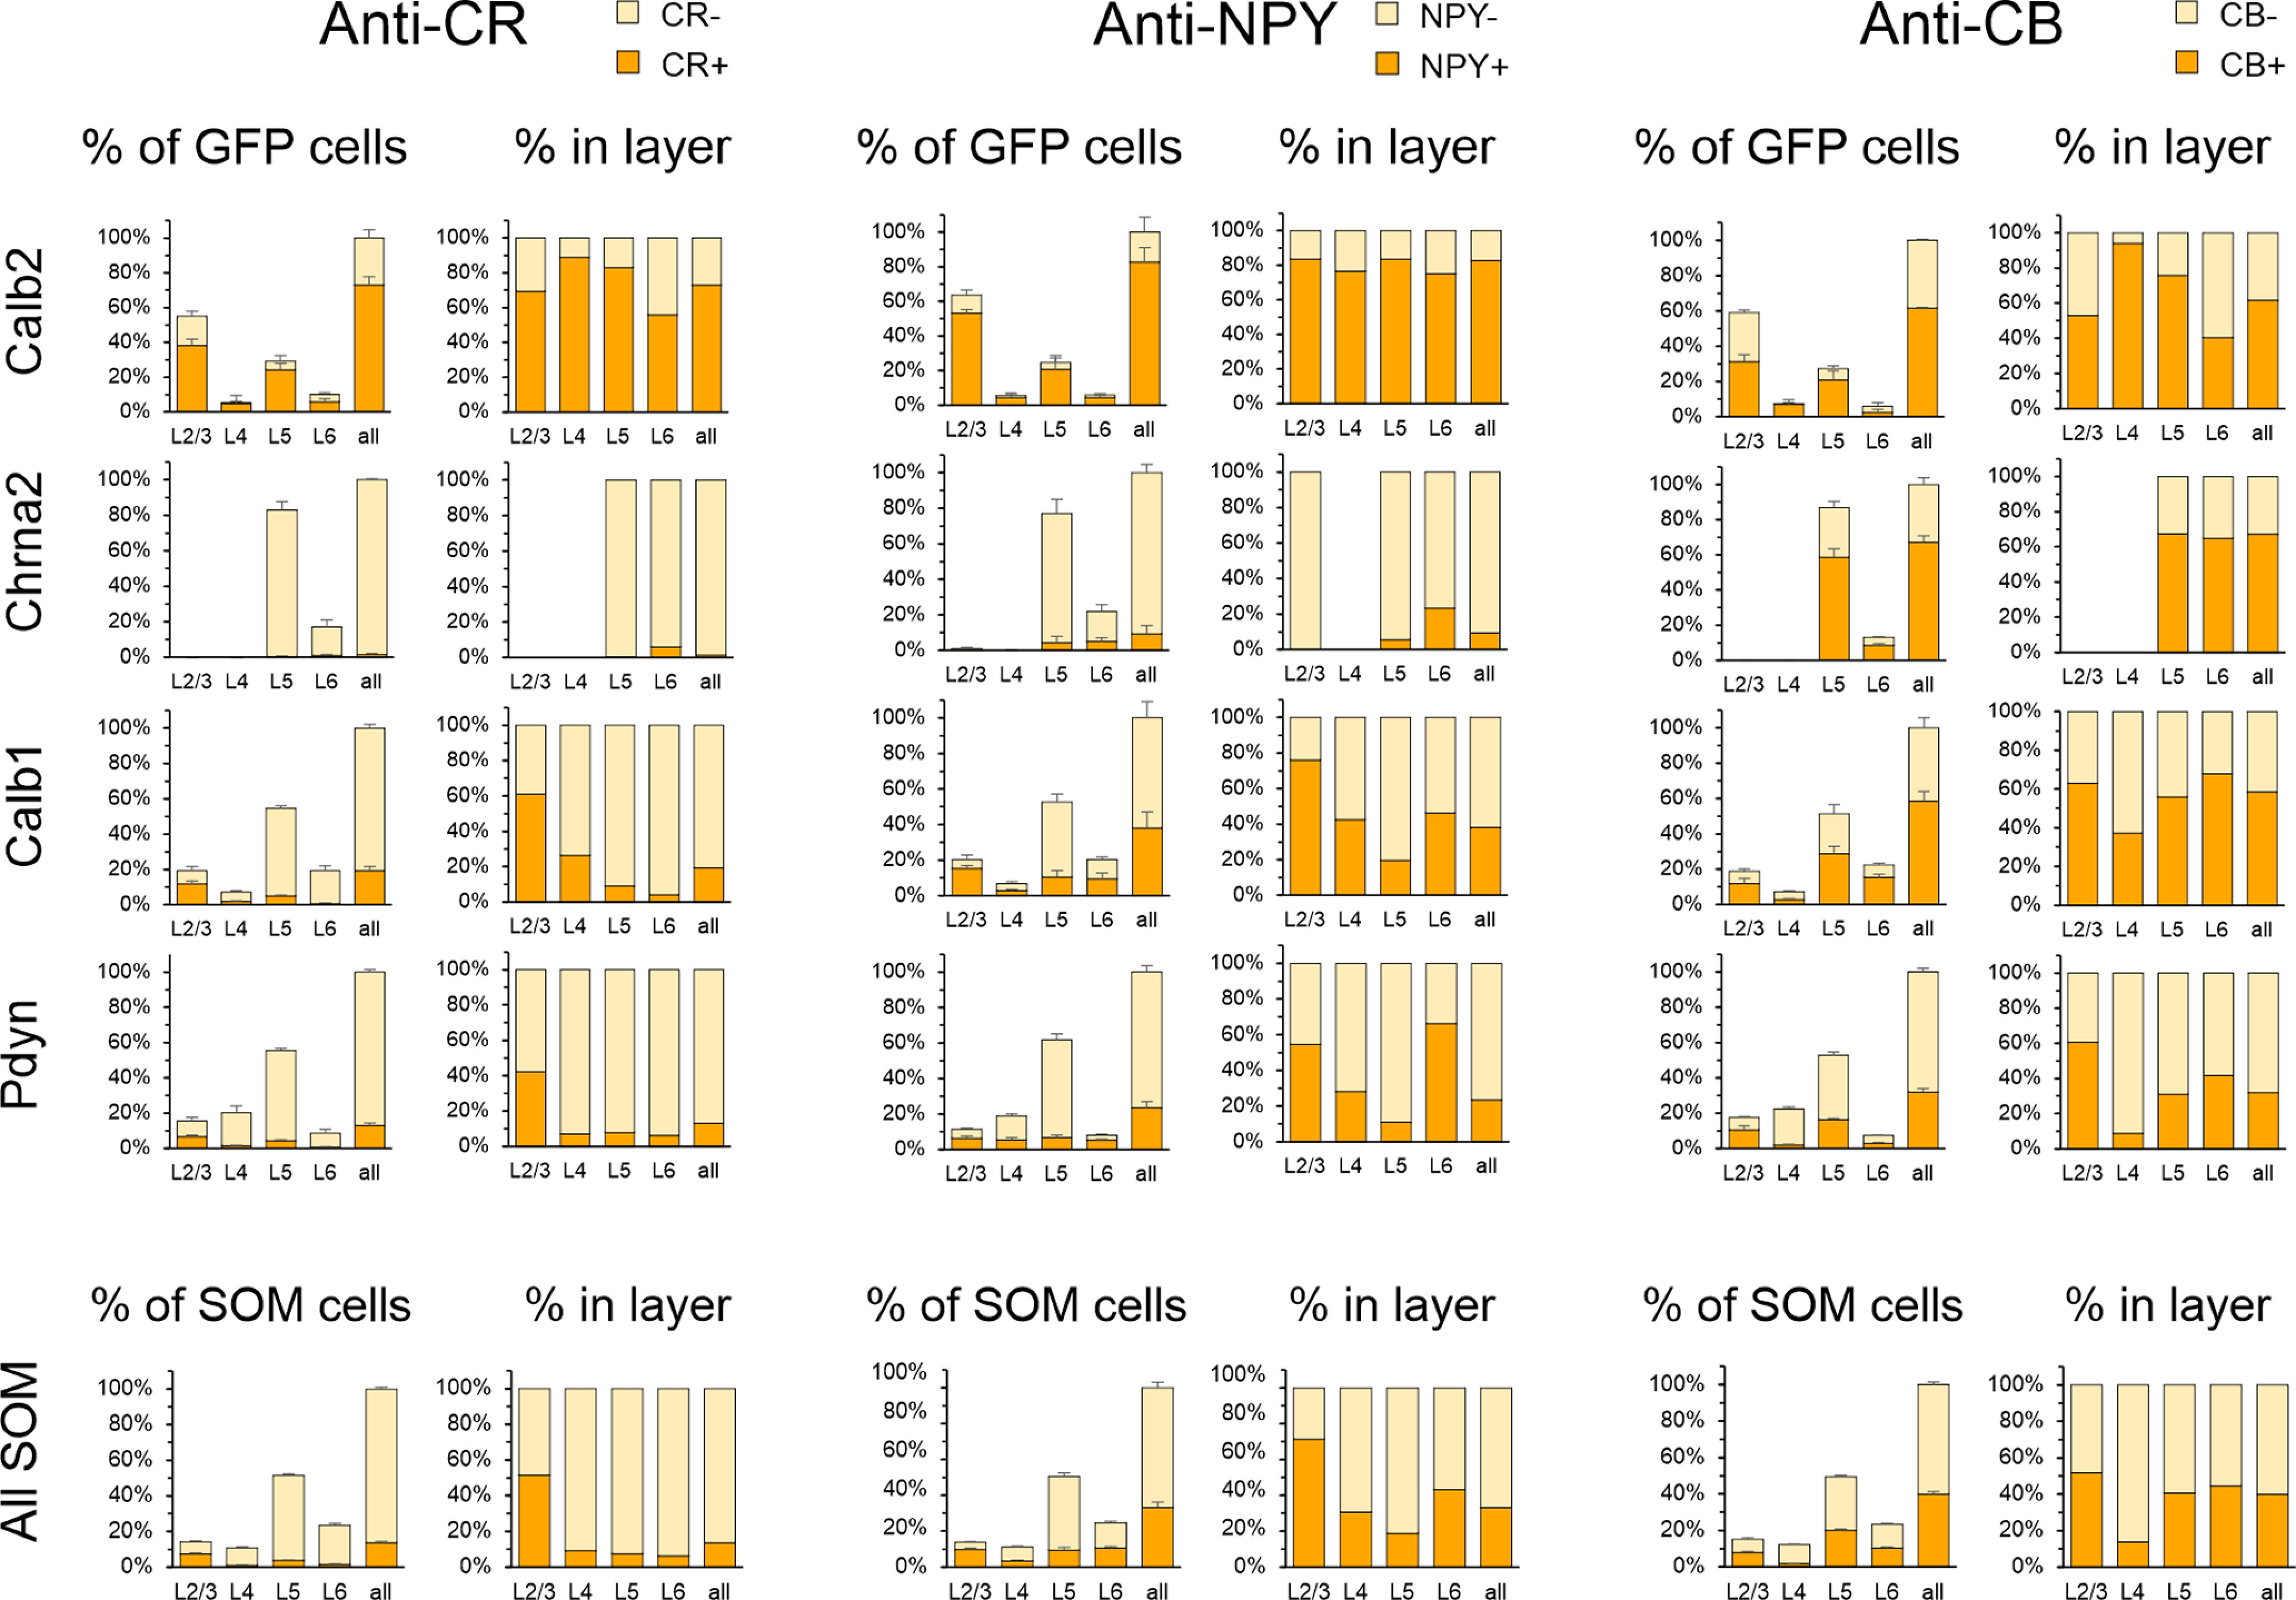
Figure 6.

Protein marker expression in the 4 intersectional subsets. Left panels in each antibody block, Percentages of CR, NPY, and CB immunostained cells in each layer of all GFP+ cells counted in each brain, averaged within each genotype (top 4 rows), or of all GFP+ and tdTomato+ cells counted in each brain, averaged over all genotypes (bottom row). Error bars are the SEM. Right panels, Same numbers expressed as percentages of all GFP+ cells (top 4 rows) or of all GFP+ and tdTomato+ cells (bottom row) counted in each layer. N = 3 mice/genotype, 12 mice total. Numerical data are provided in Table 5.
