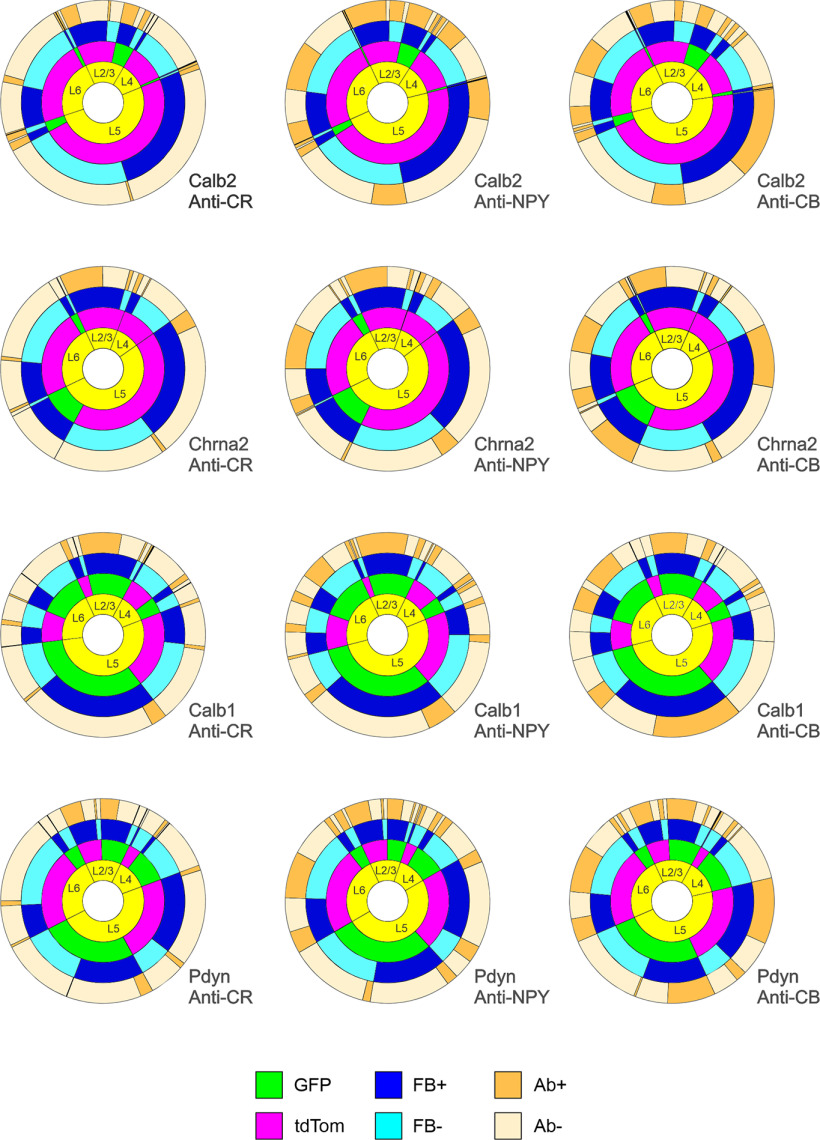
Figure 7.
Sunburst charts illustrating the correspondence between fluorescent protein expression, retrograde labeling, and protein marker immunostaining. Ab, antibody. Each chart corresponds to one genotype stained with one antibody: N = 3 brains/chart. See text for a detailed explanation of the sunburst chart format. The numerical data used to generate these charts are provided in Extended Data Figure 7-1. An interactive version can be accessed at https://sites.google.com/view/somatostatinsubtypes/home.

