
FIG 2.
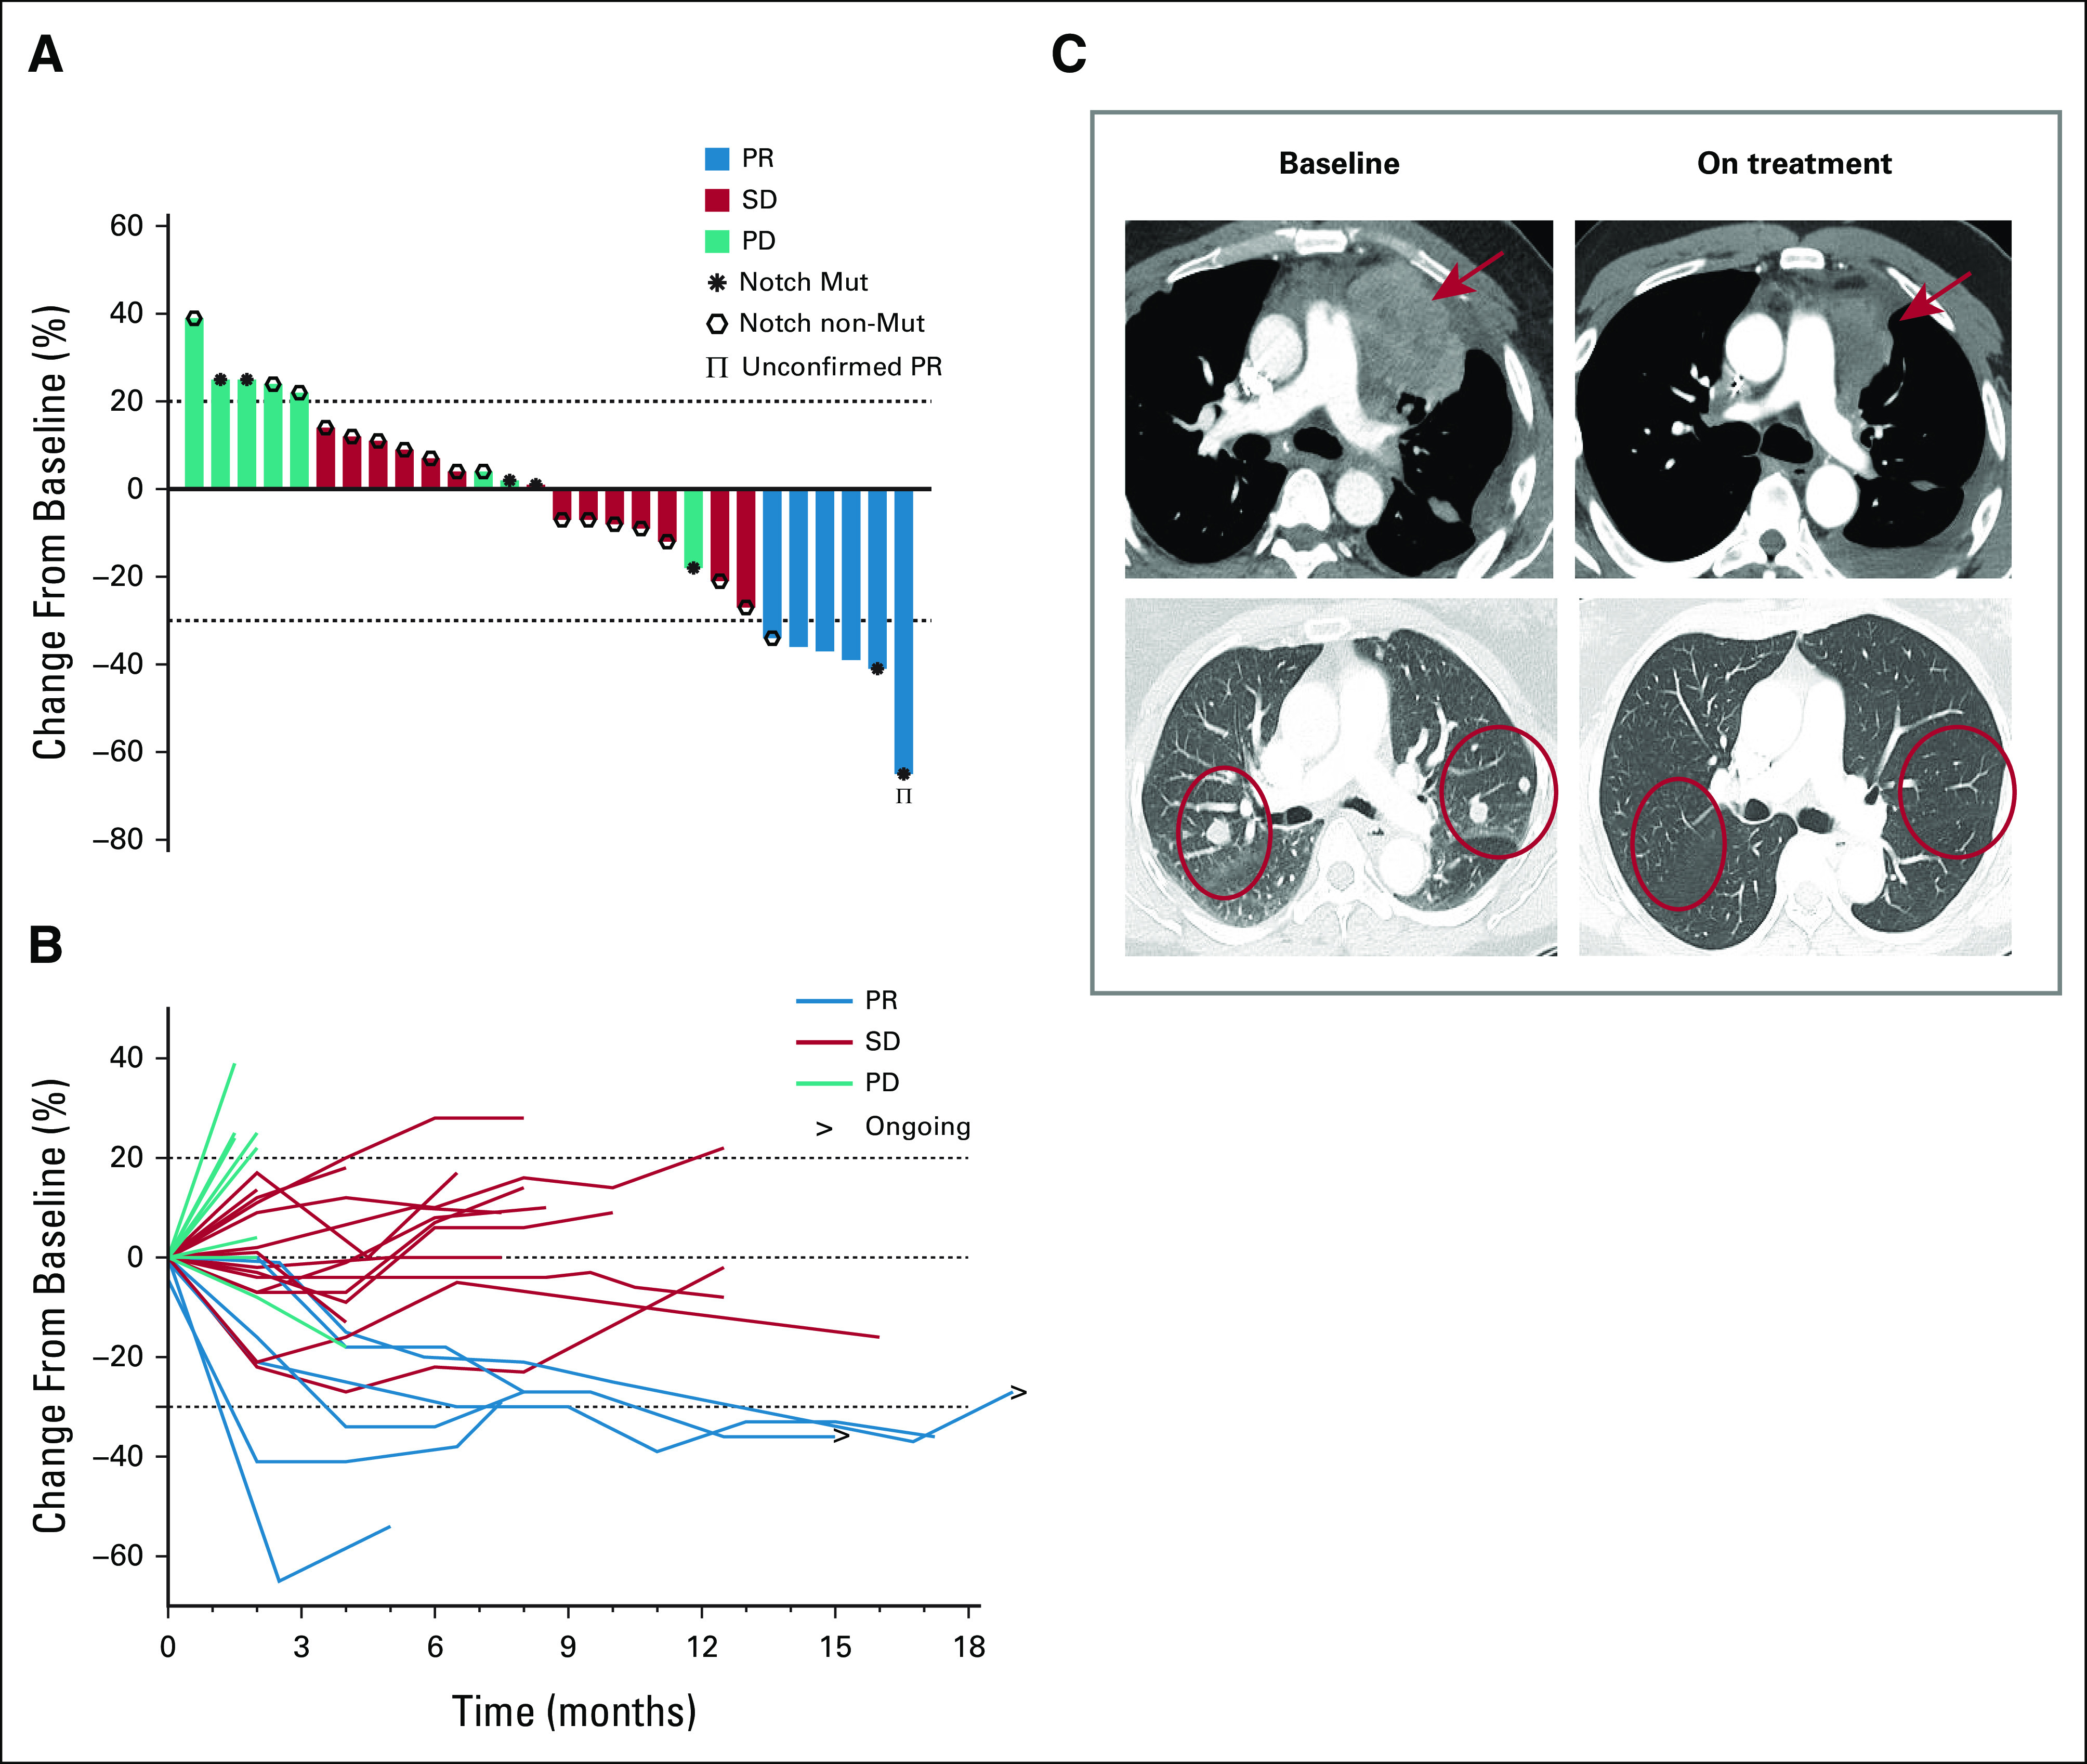
Efficacy outcomes. (A) Waterfall plot demonstrating maximum percent change in the sum of target lesions from baseline according to RECIST 1.1; each bar represents a patient. (B) Spider plot illustrating longitudinal percentage change in tumor size from baseline according to RECIST 1.1; each line represents a patient. (C) Illustrative computed tomography scans of two patients who achieved a partial response; red arrows and circles highlight metastatic tumor regions. PD, progressive disease; PR, partial response; SD, stable disease.