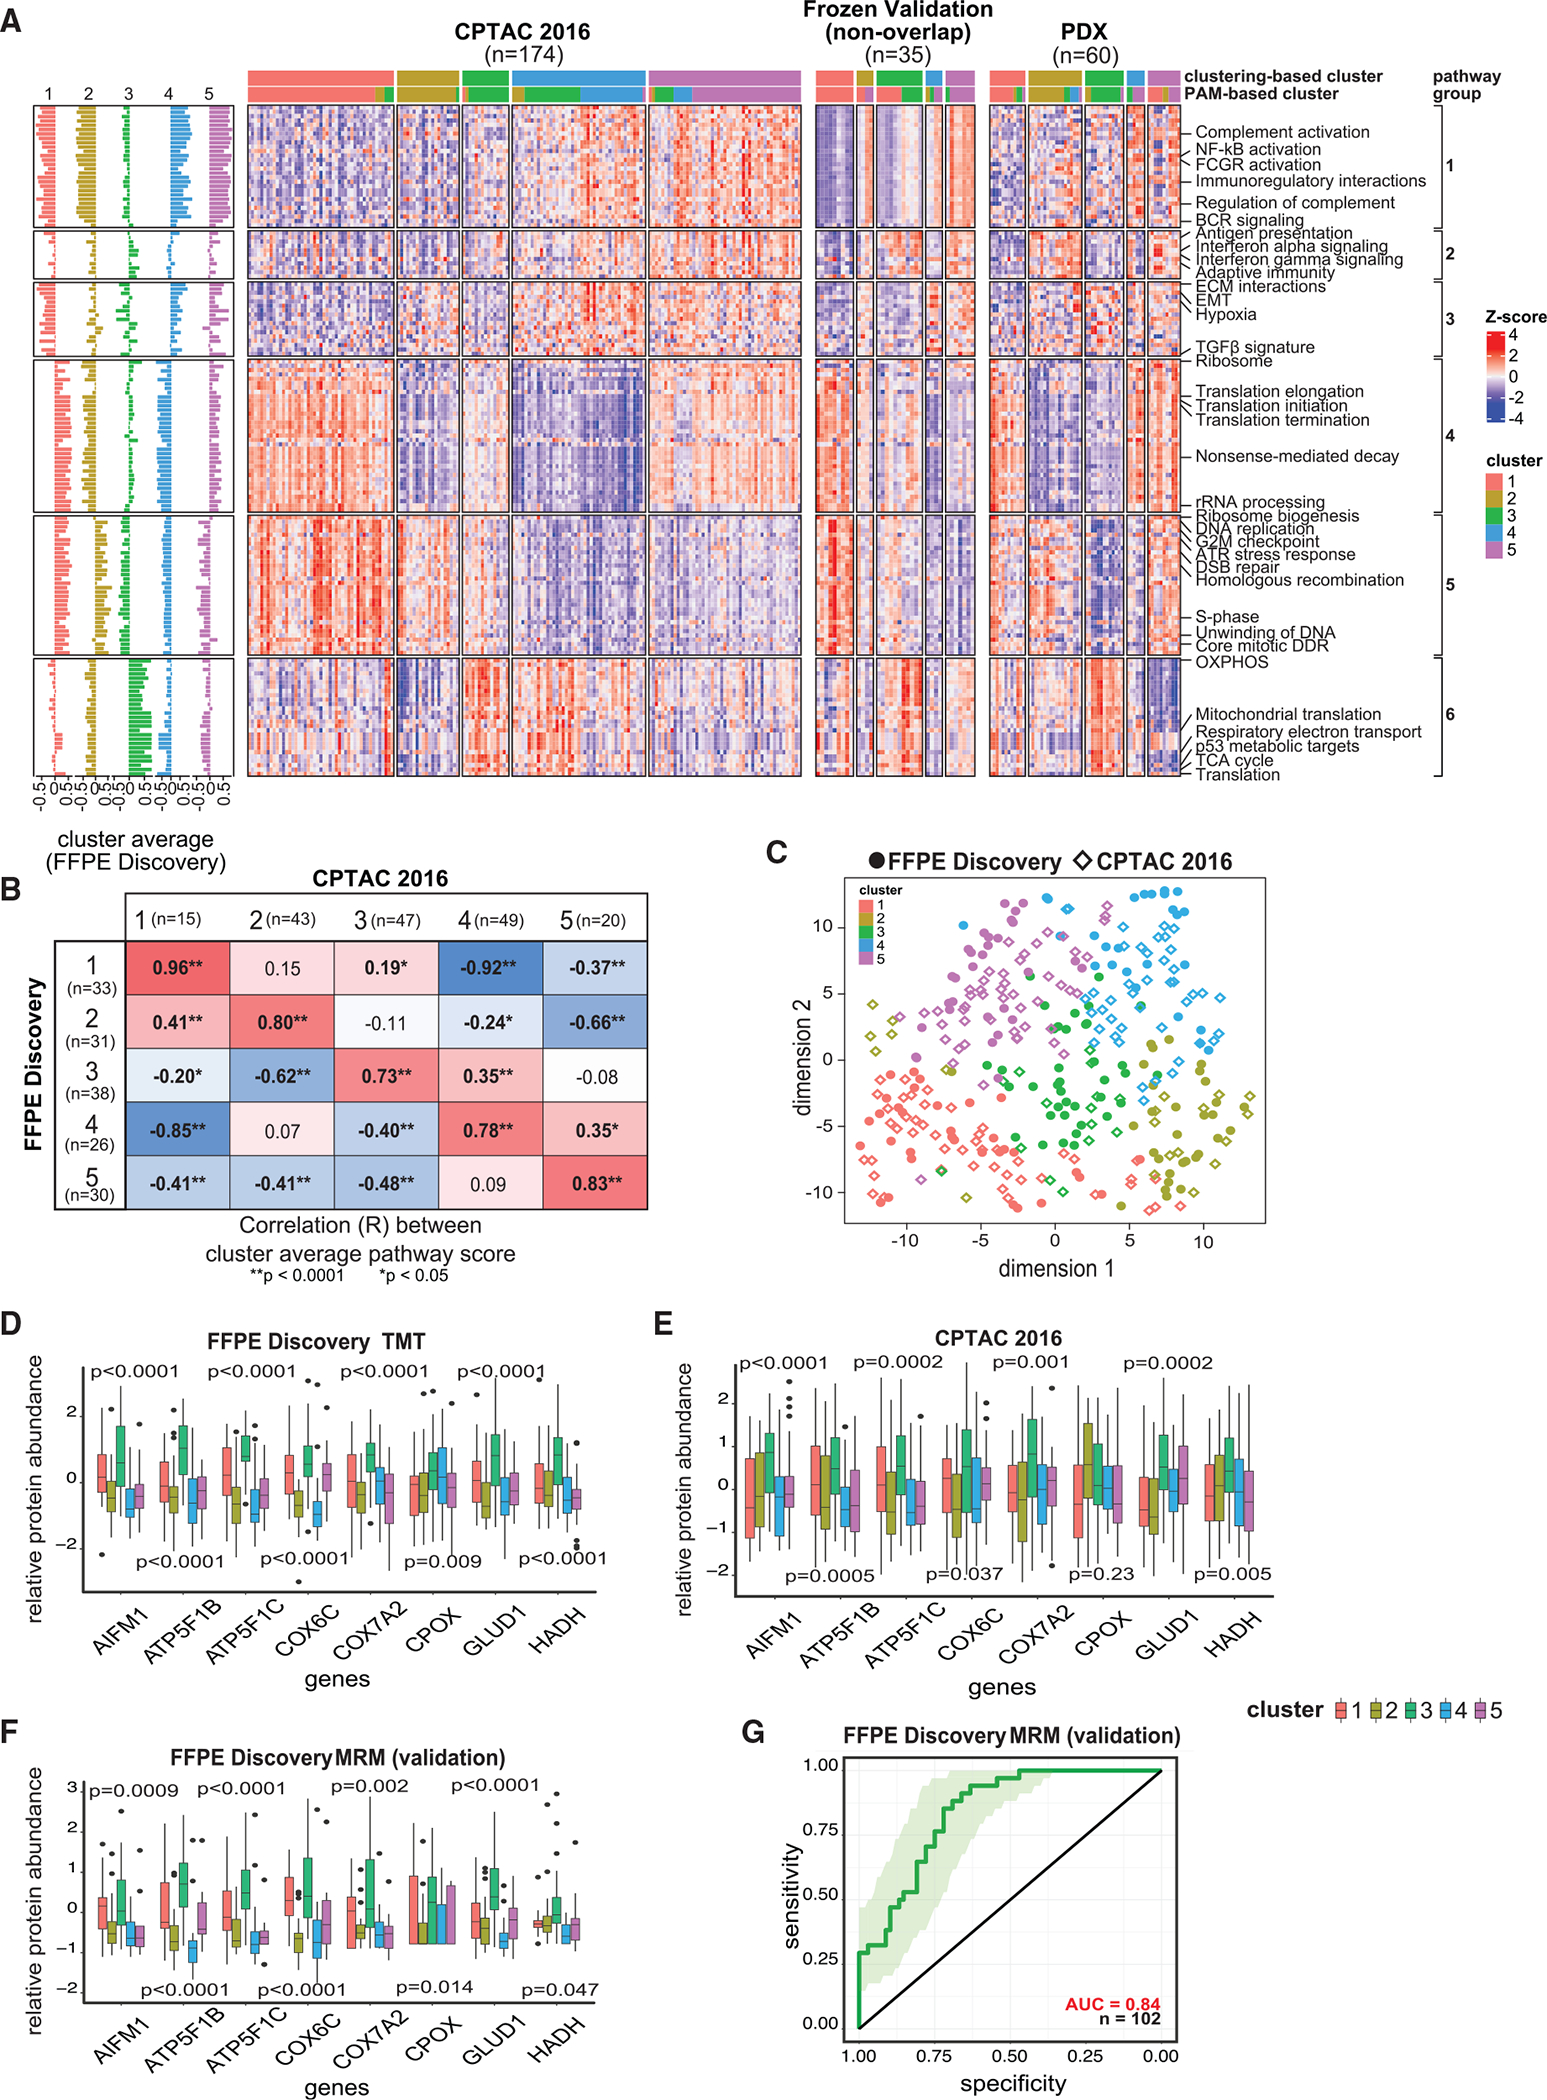
Figure 5. Validation of the proteomic clusters using independent cohorts.

(A) Heatmaps showing proteomic ssGSEA scores of 150 pathways across the 5 clusters for the samples from the CPTAC-2016 cohort,19 frozen validation cohort, and PDX proteomic dataset.42
(B) Heatmap of the Pearson correlations between the average pathway scores of each cluster in the FFPE discovery cohort vs. the CPTAC-2016 study19 (based on consensus clustering). p values are based on R function cor.test.
(C) Concordance among the 5 clusters in the FFPE discovery and the CPTAC-2016 cohorts.19 Sample sizes of the clusters in FFPE discovery cohort are respectively 33, 31, 38, 26, and 30; while those in CPTAC-201619 (based on consensus clustering) are 15, 43, 47, 49, and 20.
(D) Protein abundances of 8 metabolic protein markers showing upregulation in cluster 3 vs. other clusters. The sample sizes of the 5 clusters in FFPE discovery cohort are 33, 31, 38, 26, and 30. p values are based on Student’s t test.
(E) Protein abundances of 8 metabolic protein markers (as in D) showing upregulation in cluster 3 vs. other clusters in the CPTAC-2016 cohort.19 Sample sizes of the 5 clusters in the CPTAC-2016 cohort (based on PAM clustering) are 43, 28, 41, 26, and 36. p values are based on Student’s t tests.
(F) Protein abundances of 8 metabolic protein markers (as in D) showing upregulation in cluster 3 vs. other clusters based on MRM data. The sample sizes of the 5 clusters in FFPE discovery cohort for which MRM experiment was done are respectively 17, 27, 34, 15, and 9. p values are based on R function cor.test.
(G) ROC showing the prediction performance of the 8 metabolic protein markers (as in D) based on the average abundance of their Z scores determined by MRM.
See also Figure S5.
