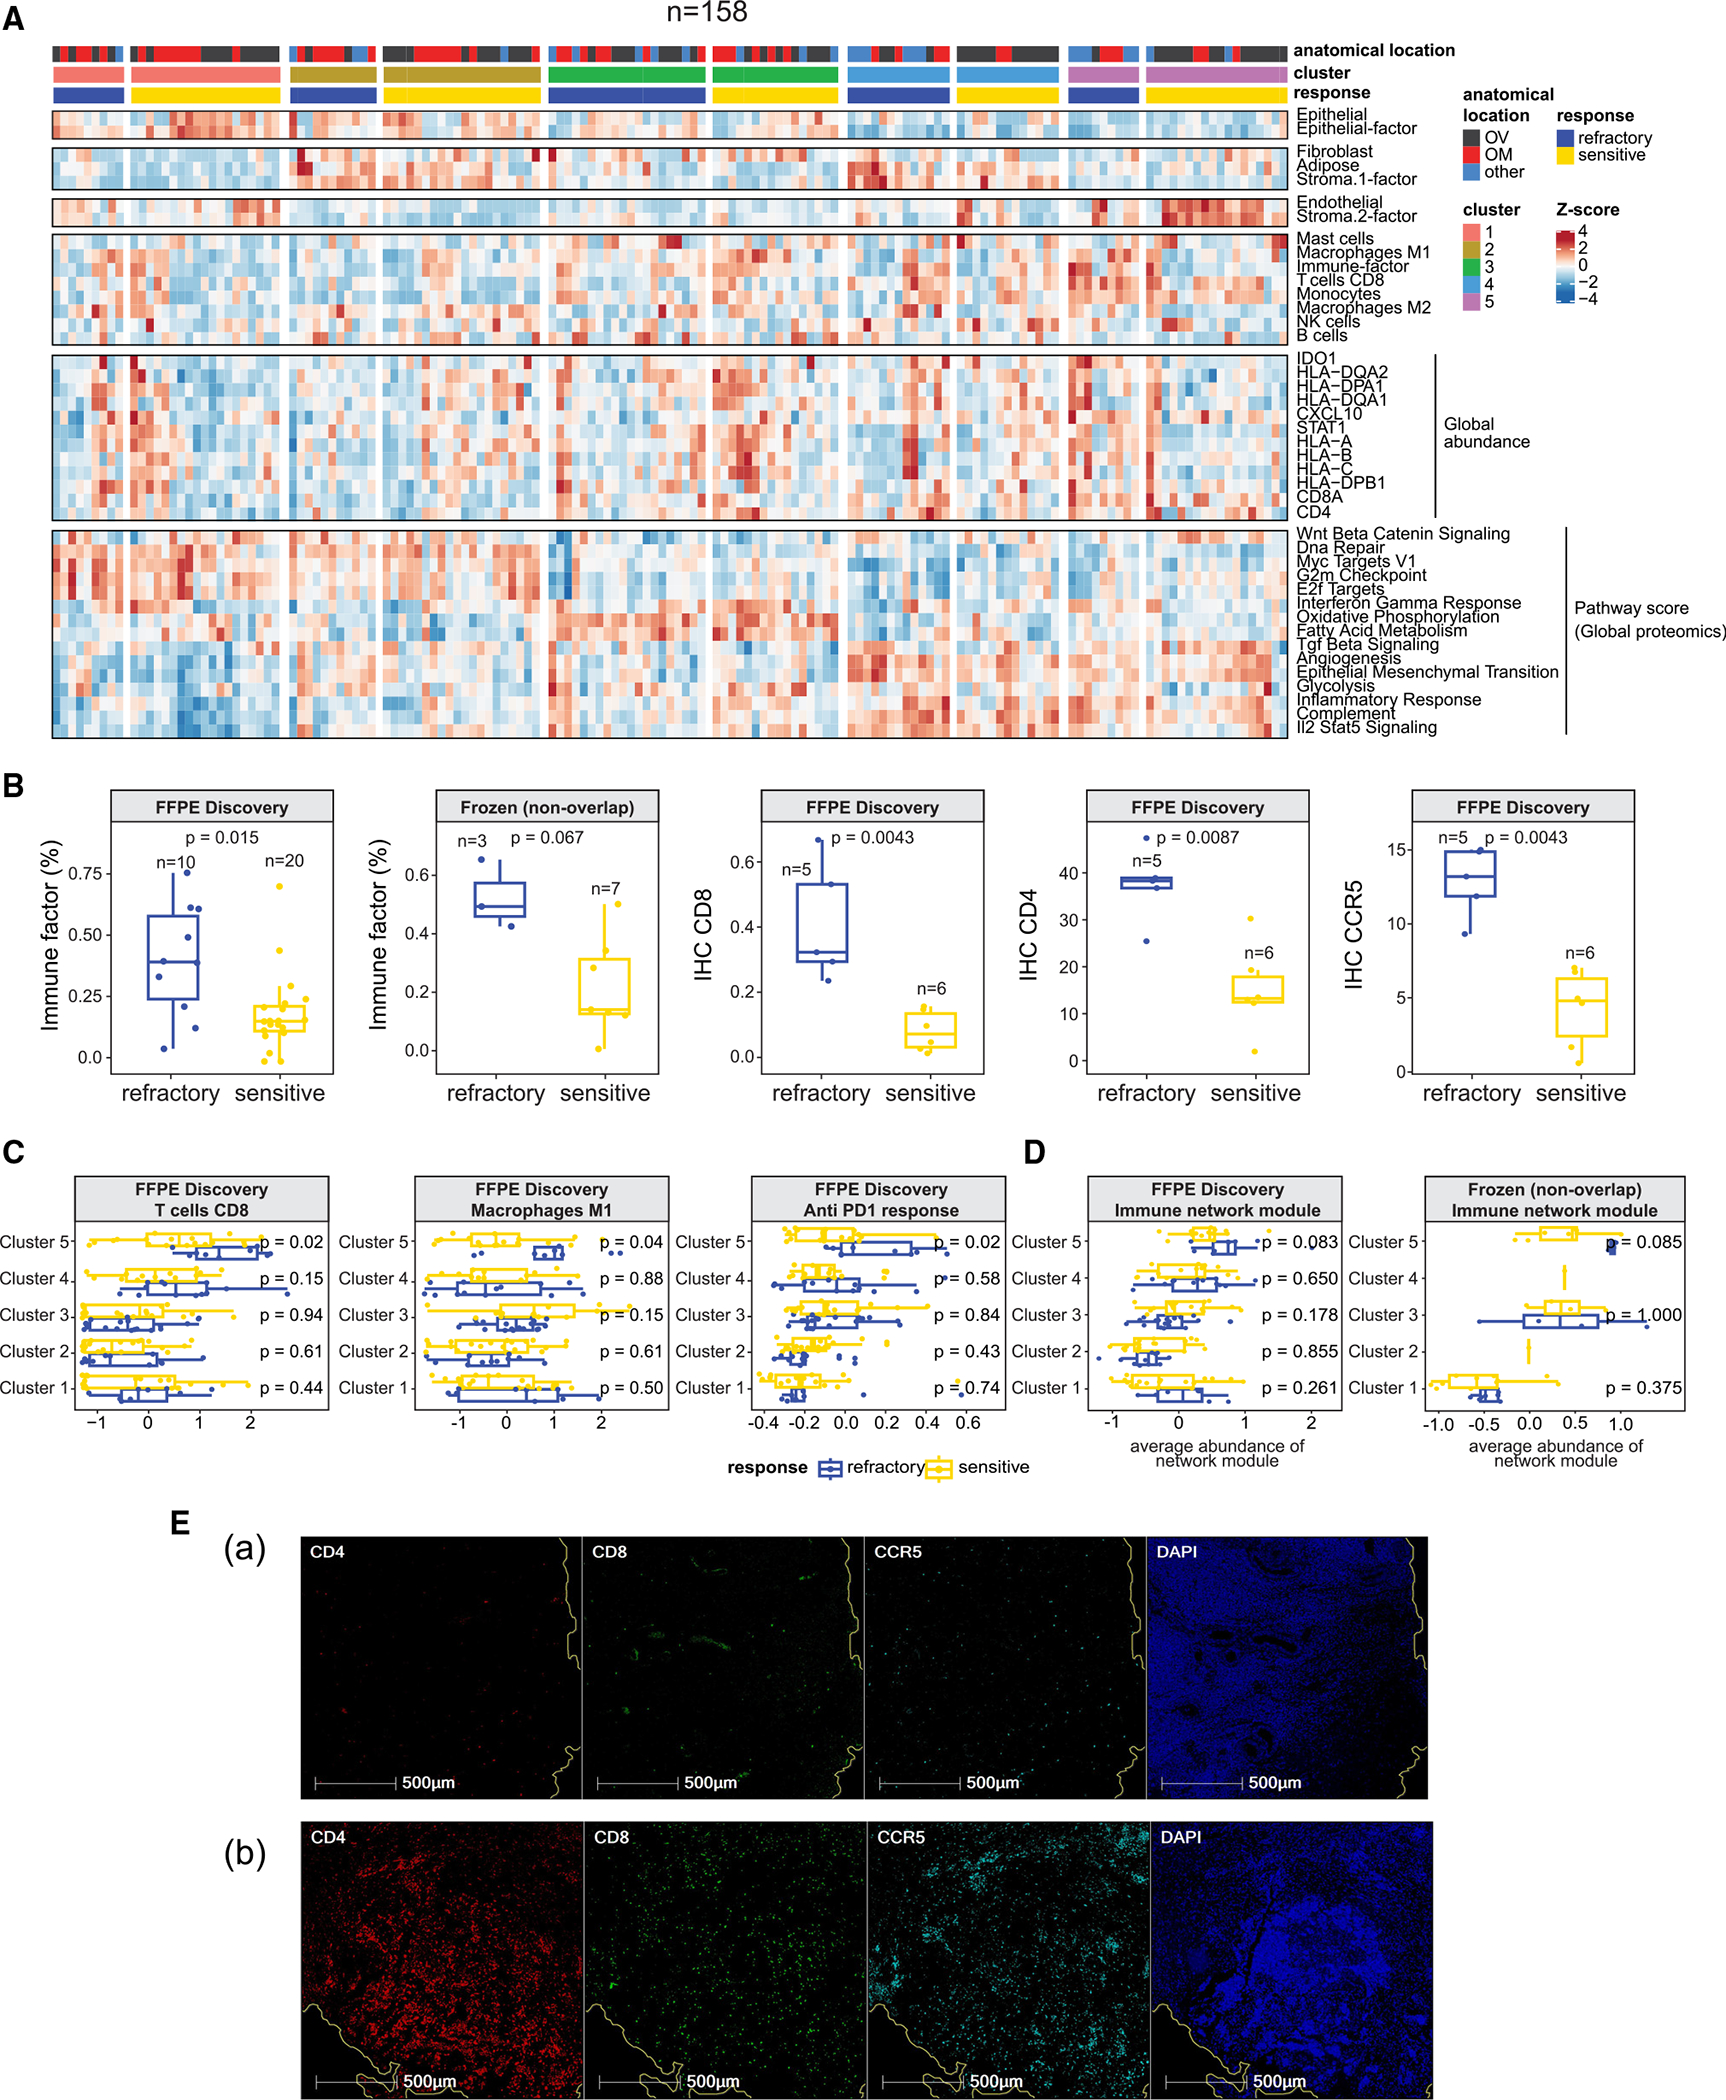
Figure 6. Tumor microenvironment landscape.

(A) Heatmap illustrating cell-type compositions of the FFPE discovery cohort (n = 158). The first four sections display cell-type proportions estimated by XDec57 and BayesDebulk.58 The fifth section includes the normalized global abundance of key immune cell markers. The last section illustrates ssGSEA pathway scores of pathways that corroborate the estimated cell-type composition.
(B) First two boxplots show the comparison of the estimated immune proportions by XDec57 among cluster 5 refractory and sensitive tumors. p values are based on Student’s t tests. The remaining three boxplots show comparison of IHC staining levels of CD8, CD4, and CCR5 between refractory and sensitive tumors. p values based on two-sided Wilcoxon Rank Sum test.
(C) Comparison of the estimated proportions by BayesDebulk58 for several immune subtypes (CD8 T cells and M1 macrophages), and anti-PD1 (programmed cell death 1) response signature across all 5 clusters and treatment response status (FFPE discovery cohort). p values are based on two-sided Wilcoxon Rank Sum test. The sample sizes of the 5 clusters stratified by response are cluster 1 (22S + 11R), cluster 2 (20S + 11R), cluster 3 (16S + 22R), cluster 4 (13S + 13R), and cluster 5 (20S + 10R).
(D) Module abundance scores (averaged Z scores of proteins mapping to the network module) across different protein clusters and response groups in the FFPE discovery and frozen validation (non-overlapping) cohorts. p values are based on two-sided Wilcoxon Rank Sum test. Sample sizes of the 5 clusters stratified by response in FFPE discovery cohort are cluster 1 (22S + 11R), cluster 2 (20S + 11R), cluster 3 (16S + 22R), cluster 4 (13S + 13R), and cluster 5 (20S + 10R); sample sizes in the frozen validation (non-overlapping) cohort are cluster 1 (10S + 7R), cluster 3 (4S + 3R), and cluster 5 (7S + 3R).
(E) Evaluation of CD8, CD4, and CCR5 expression by fluorescent multiplex immunohistochemistry. A representative chemo-sensitive HGSOC (Ea) and chemo-refractory (Eb) HGSOC were stained using the Akoya Opal Multiplex IHC assay. Tissues were counterstained offline with 4′,6-diamidino-2-phenylindole (DAPI) to identify the nuclei. Representative areas show CD4 (red), CD8 (green), CCR5 (cyan), and nuclei (blue).
See also Figure S6.
