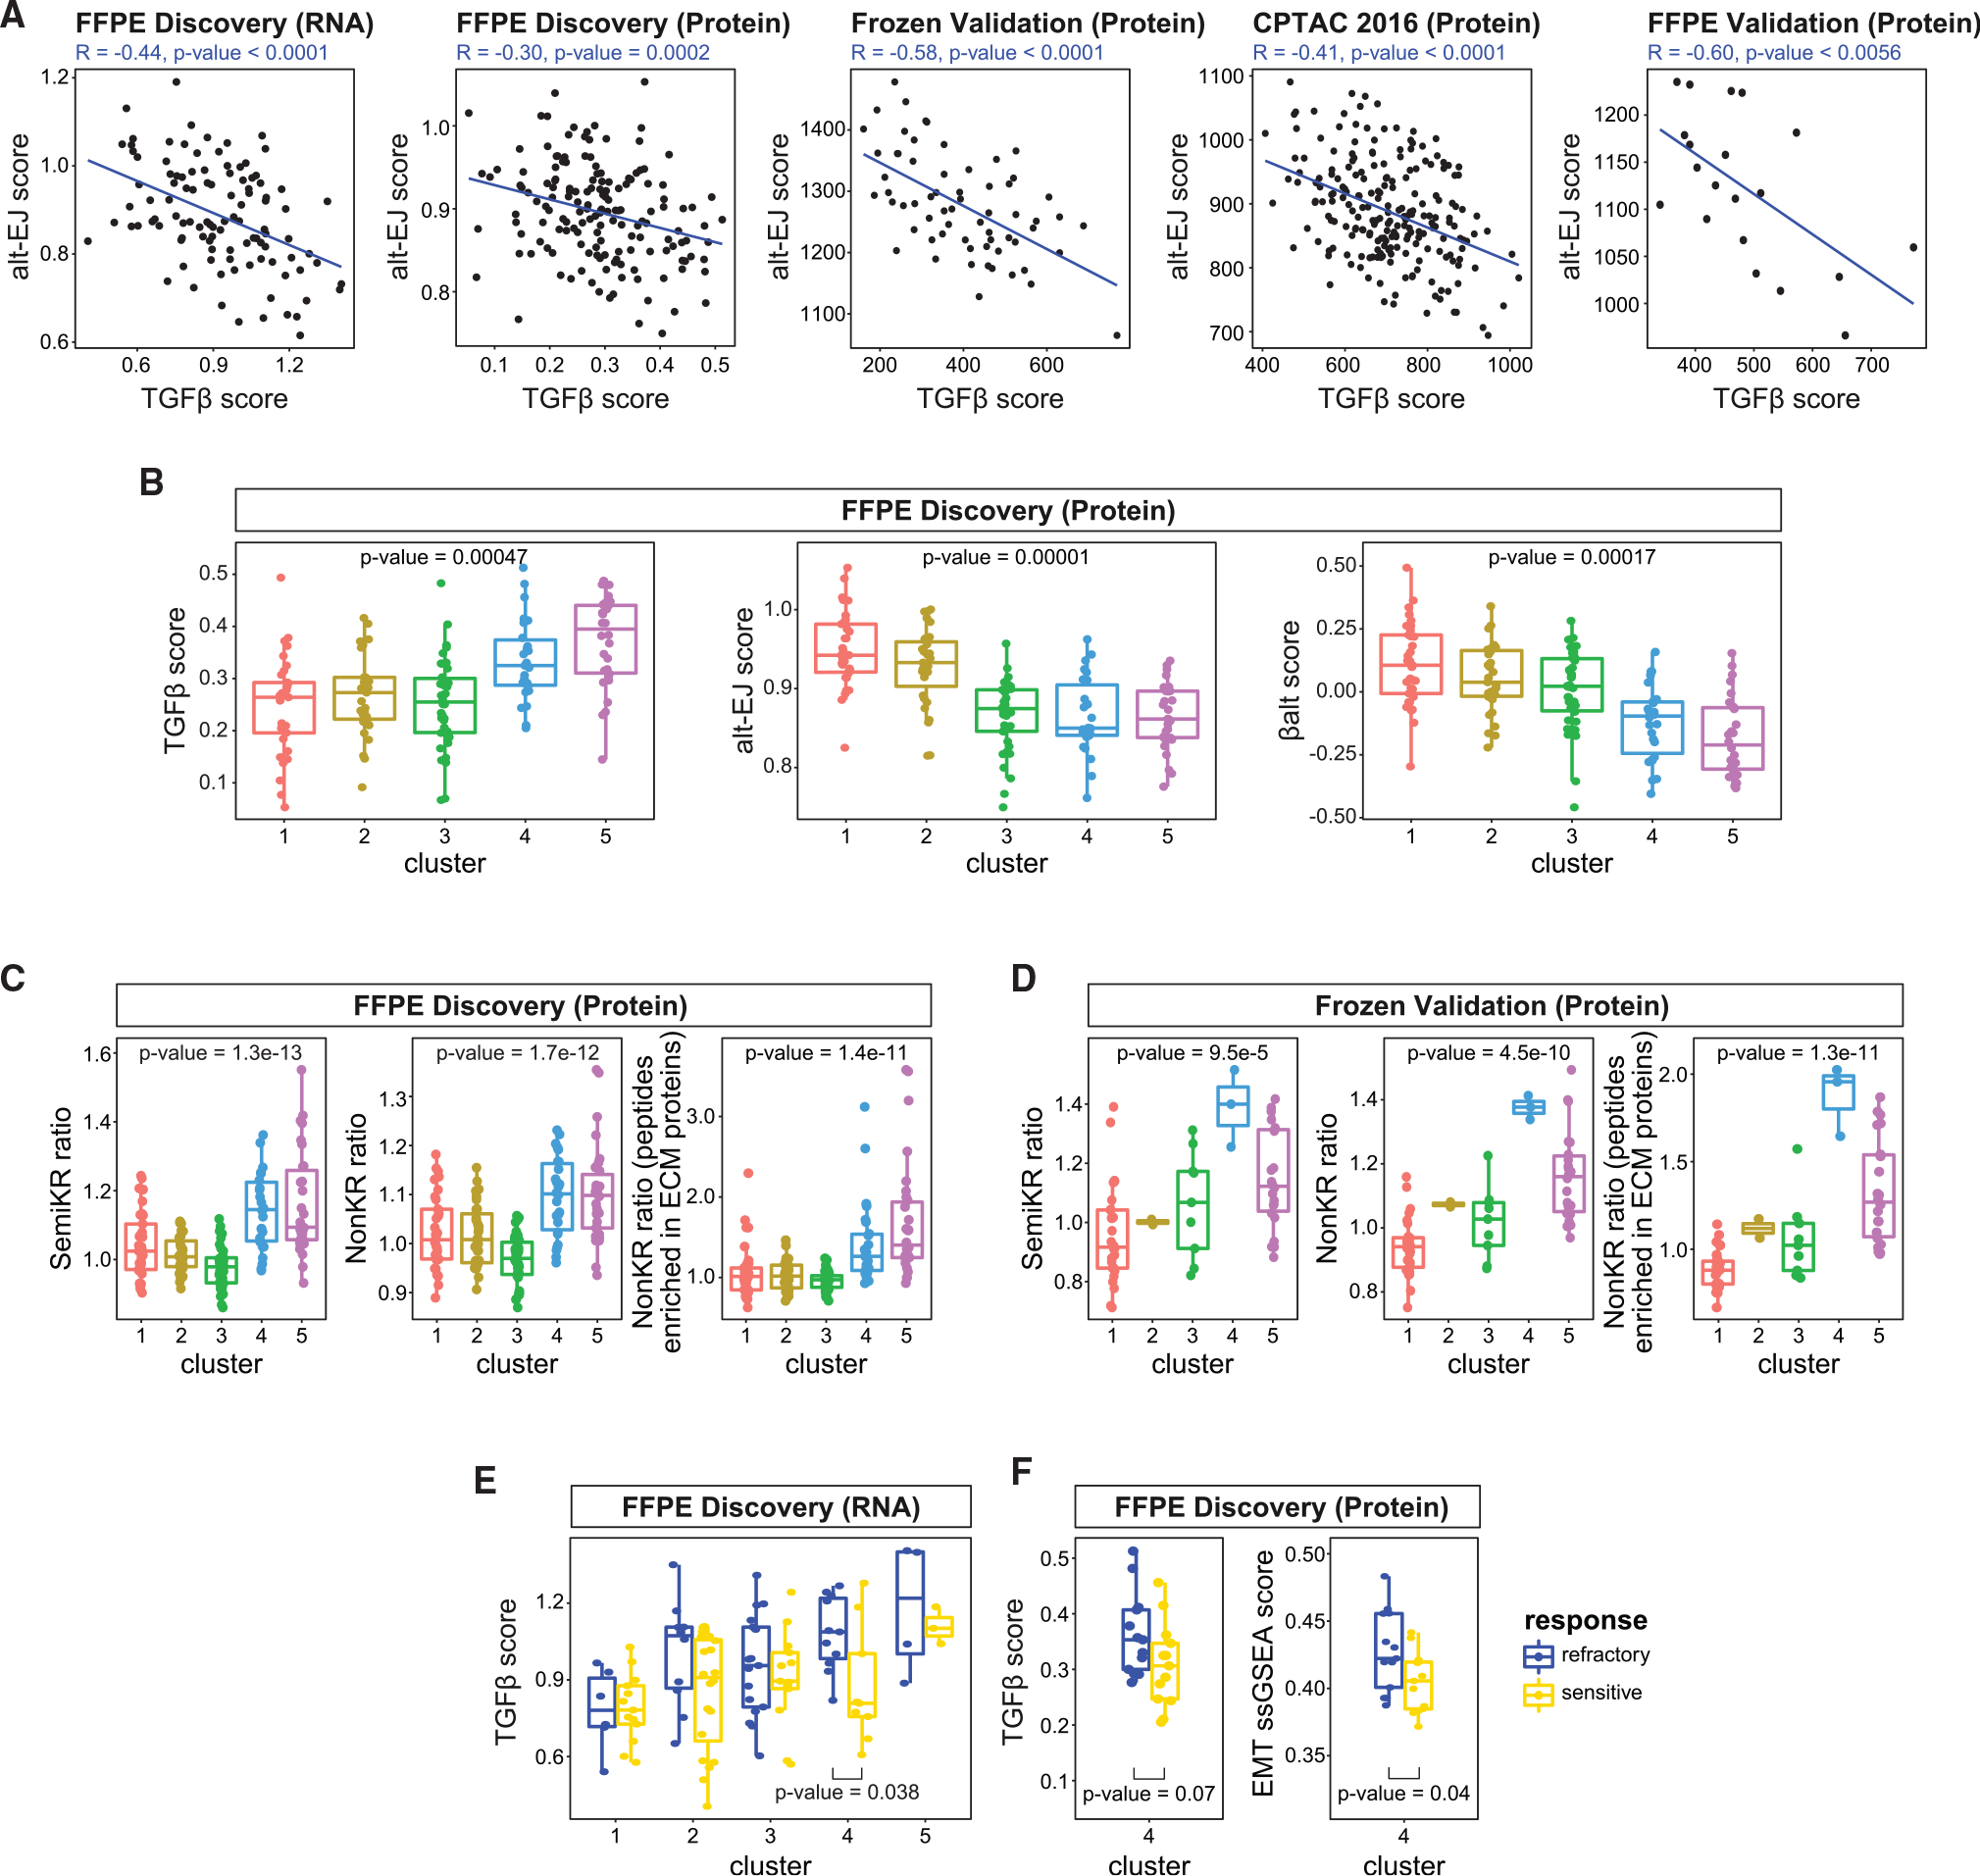
Figure 7. Association of TGF-β, alt-EJ, and βAlt scores with treatment response and clusters.

(A) TGF-β and alt-EJ scores are negatively correlated with each other across independent cohorts. p values are for testing the Pearson correlation between the two variables (R function cor.test).
(B) The TGF-β, alt-EJ, and βAlt scores are significantly correlated with proteomic clusters. The sample sizes of the 5 clusters are 33, 31, 38, 26, and 30. p values are derived from an ANOVA test based on regression analyses.
(C and D) SemiKR (semi-tryptic peptides) ratio, NonKR (non-tryptic peptides) ratio, and NonKR ECM-related ratio are elevated in clusters 4 and 5 in both the FFPE discovery (C) and the frozen validation (D) cohorts. Sample sizes of the 5 clusters in FFPE discovery cohort are 33, 31, 38, 26, and 30, while in the frozen validation cohort (based on PAM clustering) are 28, 2, 9, 3, and 22. p values are derived from an ANOVA test based on regression analyses.
(E) Based on the RNA data, the TGF-β score is higher (p = 0.038, Student’s t test) in cluster 4 refractory vs. sensitive tumors. The sample sizes of the 5 clusters in FFPE discovery cohort (based on the 106 samples in RNA data) stratified by response are cluster 1 (13S + 6R), cluster 2 (20S + 10R), cluster 3 (13S + 17R), cluster 4 (9S + 11R), and cluster 5 (3S + 4R).
(F) TGF-β score and EMT pathway ssGSEA scores are significantly higher in cluster 4 refractory vs. cluster 4 sensitive tumors. p values are determined by Student’s t test. The sample size of cluster 4 stratified by response is (13S + 13R).
See also Figure S7.
