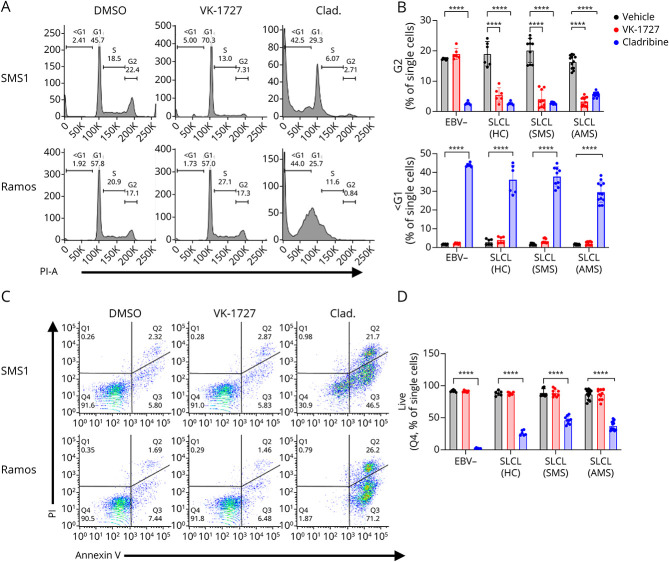
Figure 5. EBNA1 Inhibition Perturbs Cell Cycle Expression While Cladribine Induces Apoptosis in SLCLs.
(A) Cell cycle profiles comparing EBV+ and EBV− B cells treated with DMSO, VK-1727 (25 µM), or cladribine (2.5 µM) measured by flow cytometry analysis of propidium iodide staining (representative graphs for SMS1 and Ramos). (B) Graph of cell cycle kinetics data comparing the effects of VK-1727 with those of cladribine. EBV+ cells (HC1-2, SMS1-3, and AMS1-4) treated with 25 µM of VK-1727 show a significant decrease in the total population of G2 cells that is not observed for EBV− (Ramos and BJAB) B cells. In addition, while cladribine induces apoptosis, marked by an increase in the <G1 population, in all B cells regardless of EBV infection, apoptosis was not increased in EBV− or EBV+ cells treated with VK-1727. Each cell line was treated, stained, and analyzed as biological replicates. Data shown here are batched by group (EBV−, HC SLCL, SMS SLCL, and AMS SLCL) (****p < 0.0001, 2-way ANOVA). (C) Flow cytometry analysis of Annexin V/PI staining comparing EBV− and EBV+ B cells with DMSO and VK-1727 (25 µM) or cladribine (2.5 µM) (representative graphs for SMS1 and Ramos). (D) Graphs summarizing live cell populations (% Q4) observed from the Annexin V/PI experiment. Each cell line was treated, stained, and analyzed as biological replicates. Data shown here are batched by group (EBV−, HC SLCL, SMS SLCL, and AMS SLCL) (****p < 0.0001, 2-way ANOVA). EBV = Epstein-Barr virus; SLCL = spontaneous lymphoblastoid line.

