Figure 6. Iron restriction therapy restored estrogen receptor α (ERα) levels and attenuated E2-triggered progressive atherosclerosis in late postmenopausal mice.
(A) Flow diagram of mouse modeling. The mice were ovariectomized (OVX) at 8 weeks old and E2, DFP or E2 + DFP treated from 21 weeks old to 29 weeks old for 8 wk. Saline is vehicle control. Mice were fed high-fat chow one week after OVX. 13 wk post-OVX is considered as late postmenopause. (B) Oil red O-stained aortic lesions in Apoe-/- mice treated with E2, DFP or E2 + DFP as indicated. (C) The quantified lesion area of atherosclerotic plaques in the aorta from (B). n = 3, **p<0.01, *p<0.05. (D) Serum total cholesterol and total triglyceride levels. n = 6, *p<0.05, **p<0.01. (E) The iron content in the aorta and liver, detected by ferrozine assays. n = 4, **p<0.01, *p<0.05. (F) Determination of serum iron in different groups. n = 6, ***p<0.001, **p<0.01, *p<0.05. (G) Protein expression in the aorta, detected by western blotting (left) and quantified with ImageJ (right). n = 3. ****p<0.0001, ***p<0.001, *p<0.05. Student’s t-test analysis was used for (C–G).

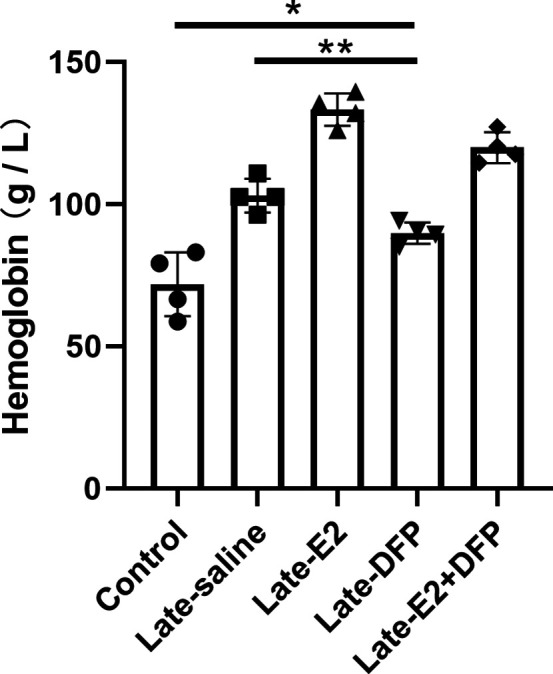
Figure 6—figure supplement 1. Serum hemoglobin after DFP administration with Student’s t-test analysis (80 mg/kg, daily for 8 wk, Apoe-/-, age 8 wk for Control, and 29 wk for the late, n = 4).