Figure 2. Scatterplots of object orientation tuning function correlations across tilts.
(a) Scatterplot of correlations for full scene stimuli. Correlations of tuning in the gravitational reference frame (y axis) are plotted against correlations in the retinal reference frame (x axis). Marginal distributions are shown as histograms. Neurons with significant correlations with respect to gravity are colored pink and neurons with significant correlations with respect to the retinae are colored cyan. Neurons with significant correlations in both dimensions are colored dark gray, and neurons with no significant correlation are colored light gray. (b) Scatterplot for isolated object stimuli. Conventions the same as in (a). (c) Same scatterplot as in (a), but balanced for number of comparison orientations between gravitational and retinal analysis. (d) Same as (b), but balanced for number of comparison orientations between gravitational and retinal analysis. Comparable plots based on individual monkeys are shown in . Anatomical locations of neurons in individual monkeys are shown in Figure 2—figure supplements 4 and 5 .

Figure 2—figure supplement 1. Scatterplot of object orientation tuning function correlations for isolated objects surrounded by a circular aperture.
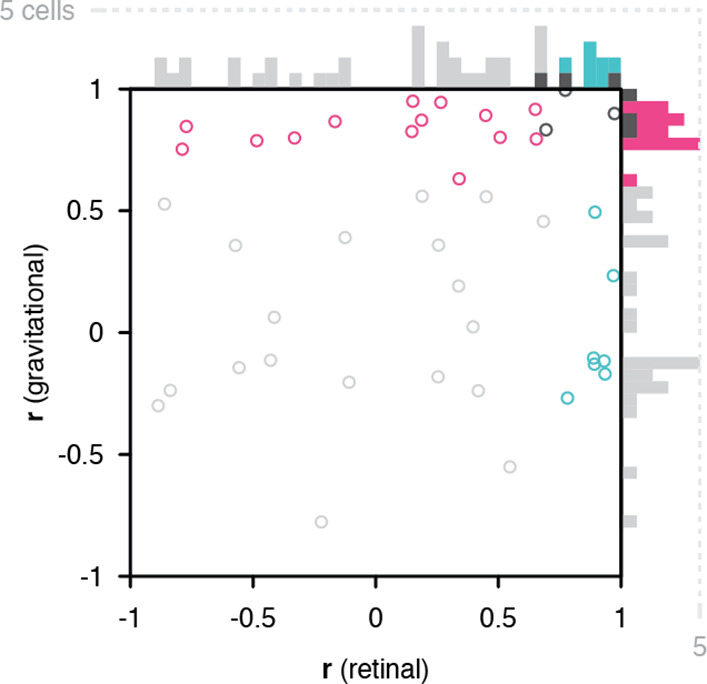
Figure 2—figure supplement 2. Results in Figure 2 plotted only for monkey 2.

Figure 2—figure supplement 3. Results in Figure 2 plotted only for monkey 1.
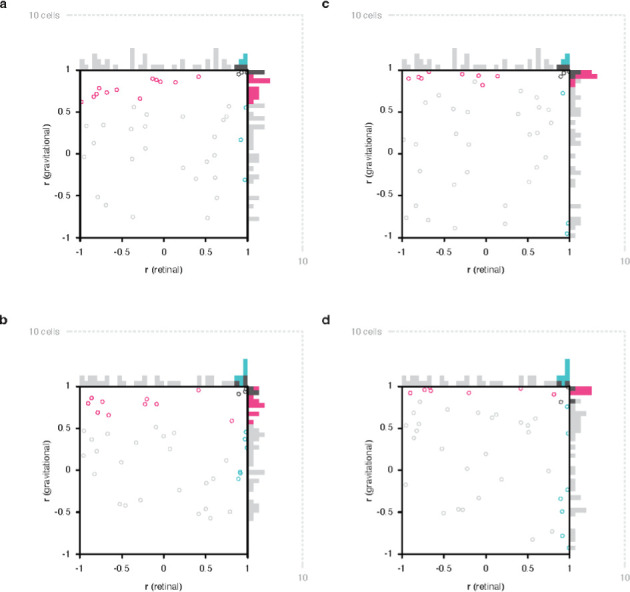
Figure 2—figure supplement 4. Anatomical locations of neurons in individual monkeys plotted in saggital projections.

Figure 2—figure supplement 5. Anatomical locations of neurons in individual monkeys plotted in horizontal projections.

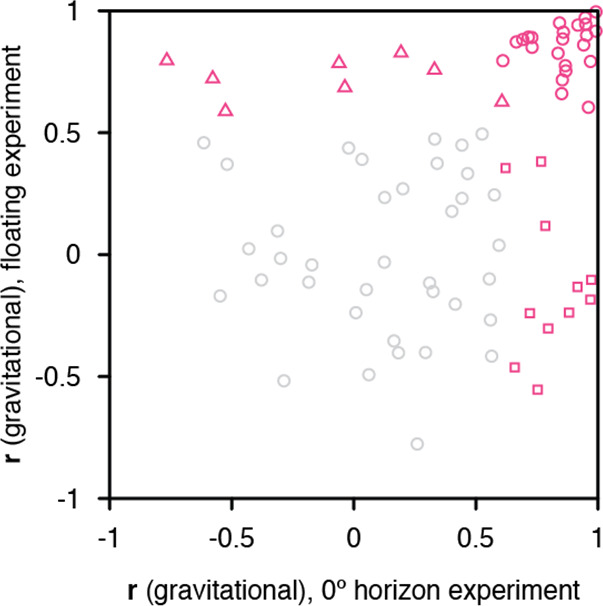
Figure 2—figure supplement 6. Scatterplot of object orientation tuning function correlations in gravitational space as measured in the scene conditions (0° horizon experiment) and the isolated object condition (floating).