
FIGURE 3.
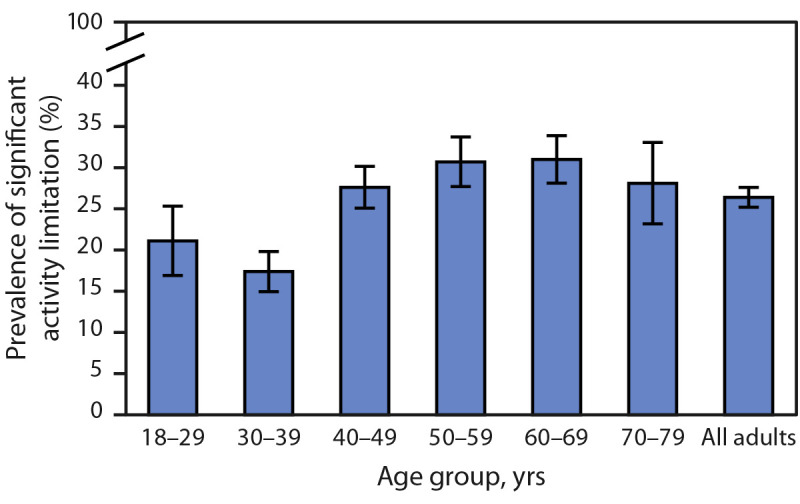
Prevalence of significant activity limitation among adults reporting long COVID* — Household Pulse Survey, United States, June 7–19, 2023
Abbreviation: NCHS = National Center for Health Statistics.
* With 95% CIs represented by error bars. Estimates for the adults aged ≥80 years do not meet NCHS Data Presentation Standards and are not included in the figure as a separate group; however, they are included in the estimate for all adults.