FIGURE 1.

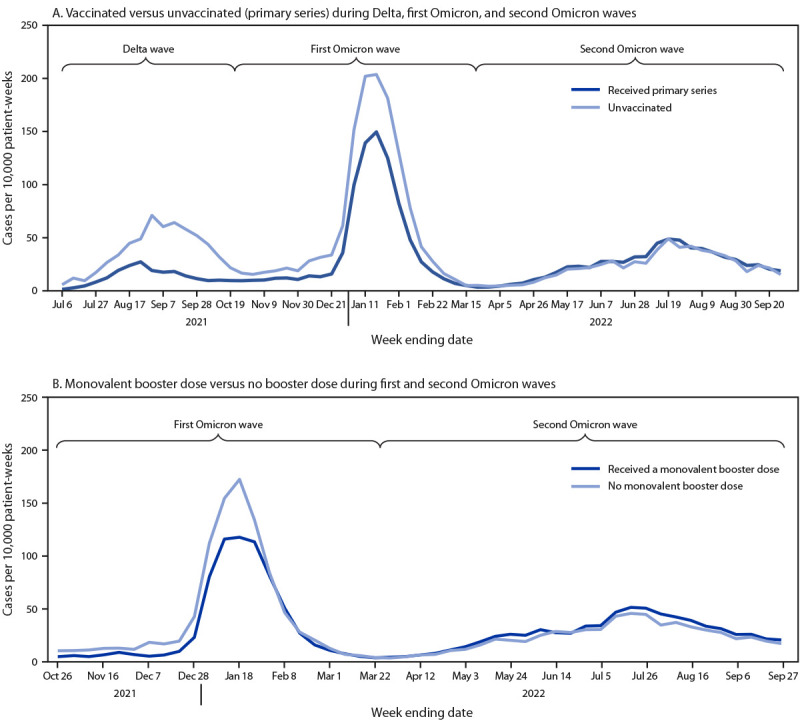
SARS-CoV-2 infections per 10,000 patient-weeks among maintenance dialysis patients, by COVID-19 primary (A) and booster dose (B) vaccination status — National Healthcare Safety Network, United States, June 30, 2021–September 27, 2022

SARS-CoV-2 infections per 10,000 patient-weeks among maintenance dialysis patients, by COVID-19 primary (A) and booster dose (B) vaccination status — National Healthcare Safety Network, United States, June 30, 2021–September 27, 2022