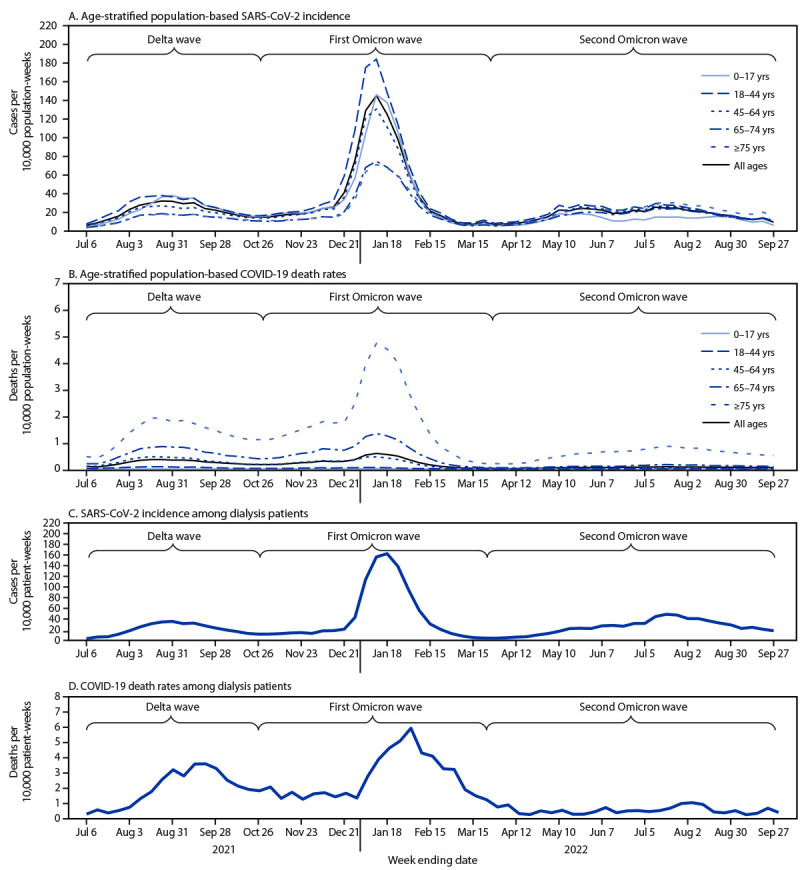
FIGURE 2.

Age-stratified population-based SARS-CoV-2 incidence (A) and COVID-19–related death rates (B) among the overall U.S. population* and SARS-CoV-2 incidence (C) and COVID-19–related deaths (D)† among maintenance dialysis patients§ — United States, June 30, 2021–September 27, 2022
* COVID-19 case surveillance public use data. https://data.cdc.gov/Case-Surveillance/COVID-19-Case-Surveillance-Public-Use-Data/vbim-akqf
† COVID-19–related deaths were defined as those among patients who died before fully recovering from SARS-CoV-2 infection.
§ Data source: National Healthcare Safety Network.
