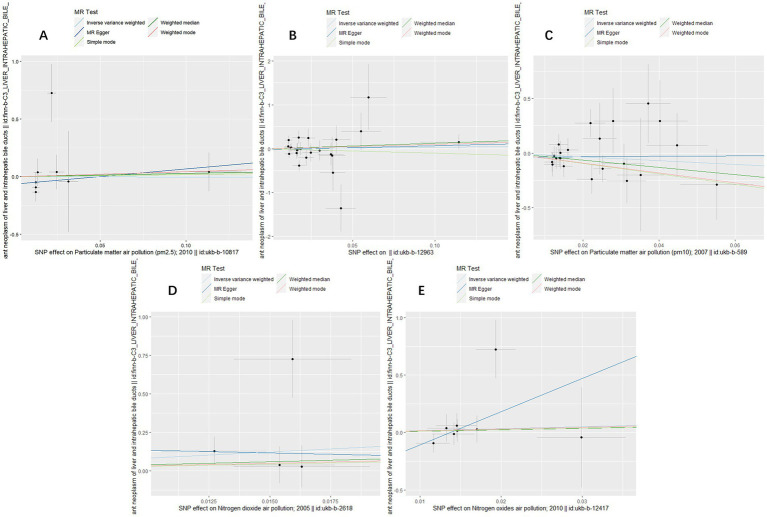
Figure 1.
Scatter plots for causal single nucleotide polymorphism (SNP) effect of air pollution (particulate matter, nitrogen dioxide and nitrogen oxides) on primary liver cancer in European population. Each black point representing each SNP on the exposure (horizontal-axis) and on the outcome (vertical-axis) is plotted with error bars corresponding to each standard error (SE). The slope of each line corresponds to the combined estimate using each method of the inverse variance weighted (light blue line), the MR-Egger (blue line), the simple mode (light green line), the weighted median (green line), and the weighted mode (pink line). (A) PM2.5; (B) PM2.5–10; (C) PM10; (D) Nitrogen dioxide; (E) Nitrogen oxides.

