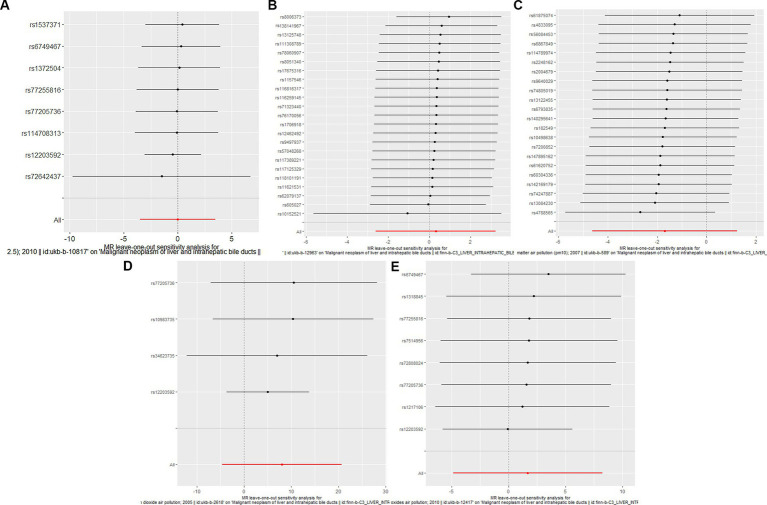
Figure 3.
Forest plots of Leave-one-out analyses for causal SNP effect of air pollution (particulate matter, nitrogen dioxide and nitrogen oxides) on primary liver cancer in European population. The error bars indicate the 95% confidence interval (CI). (A) PM2.5; (B) PM2.5–10; (C) PM10; (D) Nitrogen dioxide; (E) Nitrogen oxides.

