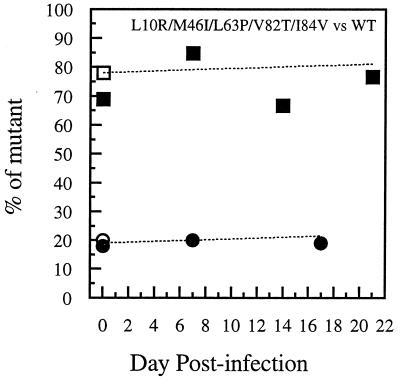
FIG. 3.
Fitness dynamics based on clonal analysis of mixed competitive infections of MT2 cells with a drug-resistant HIV-1 mutant selected by indinavir in vivo versus WT. Coinfections were carried out with nonequivalent amounts of PI-resistant L10R/M46I/L63P/V82T/I84V mutant versus WT (NL4-3). The proportion of mutant virus is plotted over time. Two experiments, each initiated with a different proportion of the two viruses, are plotted. A mean of 15 clones was analyzed at each time point of the culture of L10R/M46I/L63P/V82T/I84V mutant versus WT starting with either 20% (circles) or 80% (squares) of the L10R/M46I/L63P/V82T/I84V mutant; the percentage of L10R/M46I/L63P/V82T/I84V mutant is depicted over time. Open symbols on day 0 refer to input TCID50 proportions (mutant TCID50/total TCID50). Solid symbols on day 0 refer to proportions of clones determined by clonal genotyping (number of mutant clones/total number of clones). The dotted lines show the percentage of the mutant predicted by a formula (42) used in several other studies of the relative fitness of drug-resistant HIV-1 mutants (16, 22, 57); the relative fitness determined at day 7 was used to solve for proportions at other time points.

