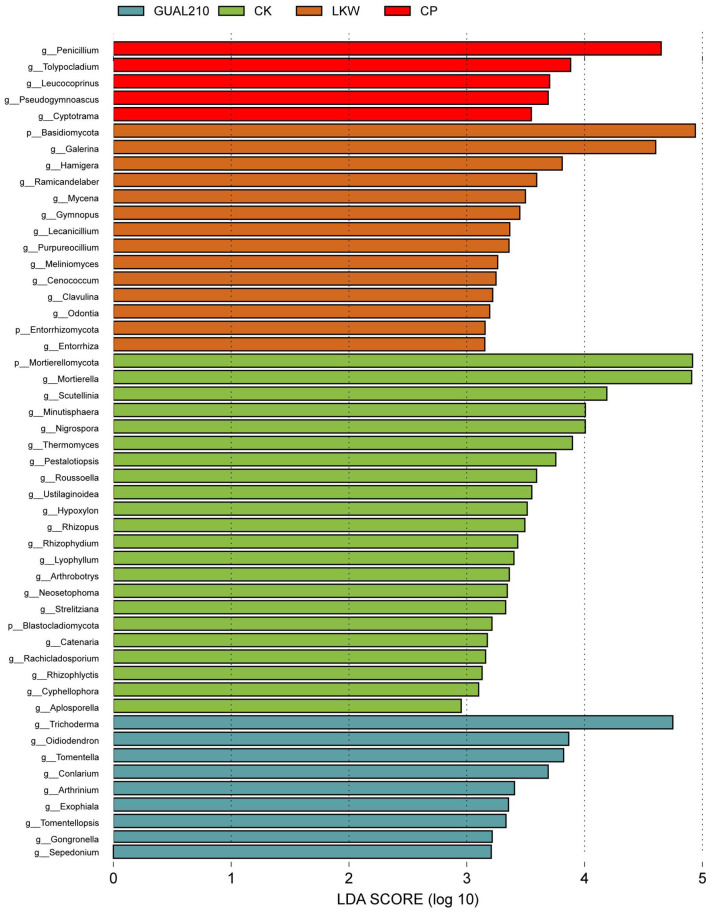
Figure 5.
LEfSe analysis of the Cladogram. Each transverse column represents a species, and the length of the column corresponds to the LDA value. The higher the LDA value, the greater the difference. The color of the column corresponds to the group of characteristic microorganisms to which the species belongs, and the characteristic microorganisms (biomarkers) indicate species with a relatively high abundance in the corresponding group.

